Comtrac's Statistics Reports (see Generate Statistics Reports) are all API accessible, allowing users to import Comtrac data from them directly into Power BI (or similar applications) without the need to manually download spreadsheets. This data can also be set to refresh automatically to keep reports up to date.
Contents

GETTING STARTED
To get started you'll need:
- The Power BI Desktop App; and
- A Comtrac Account.
STEP-BY-STEP
Building Comtrac Statistics Report API's
Within Power BI reports you will need to add the API endpoint (in the form of URL's) of each Comtrac Statistics Reports into them to import data. The URL's will look similar to the below example:
EXAMPLE URL
Report ID = 204 (Outcomes) | From Date = 11/22/2023 (MM/DD/YYYY Format)
https://test-cots.comtrac.com.au/bi/api/Report/statistics?FromDate=11%2F22%2F2023&ReportType=204&PageIndex=0&PageSize=500
NOTE: The API example above has only captured a "From Date" filter, which will return data from that date up until a current date. To add in a "To Date" filter range, see step 3.b.
Steps to Build your Agency / Organisation Specific API URL:
NOTE: The API URL sections that are in bold, are the sections that are being focused on for each step below.
-
COMTRAC ENVIRONMENT DOMAIN: https://test-cots.comtrac.com.au/bi/api/Report/statistics?FromDate=11%2F22%2F2023&ReportType=204&PageIndex=0&PageSize=500
- Add in the domain of your organisation's Comtrac environment that you're importing data from in the same format as above (in this example, the environment we are using is Comtrac's internal test environment with the domain "test-cots.comtrac.com.au").
-
REPORT TYPE: https://test-cots.comtrac.com.au/bi/api/Report/statistics?FromDate=11%2F22%2F2023&ReportType=204&PageIndex=0&PageSize=500
- Leave this report type section as is.
-
FROM DATE: https://test-cots.comtrac.com.au/bi/api/Report/statistics?FromDate=11%2F22%2F2023&ReportType=204&PageIndex=0&PageSize=500
-
Add in the "From Date" filter (MM/DD/YYYY) for your report in the same format as above (in this example we are looking to import data from the 11/22/2023 onwards).
-
See below for the list of dates each report is filtering on.
- Date format is MM/DD/YYYY
-
- "TO DATE" Filter Range (optional): If required, add a "To Date" filter into the URL to specify a precise date range, which will look similar to the below (the "To Date" range below is 12/23/2024):
-
-
TO DATE: https://test-cots.comtrac.com.au/bi/api/Report/statistics?FromDate=11%2F22%2F2023&ToDate=12%2F23%2F2024&ReportType=204&PageIndex=0&PageSize=500
-
REPORT ID: https://test-cots.comtrac.com.au/bi/api/Report/statistics?FromDate=01%2F01%2F2023&ReportType=204&PageIndex=0&PageSize=500
- Add the relevant report ID (example above is 204 - Outcomes Report) from the list of Statistics Reports below in the same format as above.
- Offences Report ID = 200
- Entities Report ID = 201
- Incidents Report ID = 202
- Conclusions Report ID = 203
- Outcomes Report ID = 204
- Task Details Report ID = 205
- Running Sheets Report ID = 207
- Property Report ID = 208
- Triage Assessment Report ID = 209
- Add the relevant report ID (example above is 204 - Outcomes Report) from the list of Statistics Reports below in the same format as above.
-
PAGE INDEX: https://test-cots.comtrac.com.au/bi/api/Report/statistics?FromDate=11%2F22%2F2023&ReportType=204&PageIndex=0&PageSize=500
- Leave the page index set to 0 to return all relevant records starting from the first. To return all the records you need, you should only need to adjust the Page Size in step 6.
- Incremental page indexes: If needed you can apply incremental page indexes to return a specific number of results. For example, if the page index = 1 and the page size below = 10, the results returned will be results 11-20 (excluding the first 10). This is only ideal if you want to exclude some known results.
-
PAGE SIZE: https://test-cots.comtrac.com.au/bi/api/Report/statistics?FromDate=11%2F22%2F2023&ReportType=204&PageIndex=0&PageSize=500
- Add the number of records you want to return in your API URL. If you're unsure how many records you need to return, the recommended maximum page size is 500 records, with a theoretical maximum of 999999999 records.
- NOTE: If your report has a large amount of records, your query may timeout. If so, try limiting your records returned by reducing the page size and separating your queries by the page index, OR preferably, reducing your date range (See Server Error / Timeouts)
- More than 999999999 records: If you're unsure if the API URL has more than 999999999 records associated, try adding PageIndex=1 into the URL and pasting it into your browser (e.g. https://test-cots.comtrac.com.au/bi/api/Report/statistics?FromDate=01%2F01%2F2023&ReportType=204&PageIndex=1&PageSize=999999999). If records are returned, you may also want to add this additional API URL into your Power BI reports to ensure data isn't excluded.
- Add the number of records you want to return in your API URL. If you're unsure how many records you need to return, the recommended maximum page size is 500 records, with a theoretical maximum of 999999999 records.
SERVER ERROR / TIMEOUTS: If your API query is timing out because there is a large amount of data being captured, try creating multiple queries of the same report ID with reduced date ranges instead to address this.
For example, if your date range is 01/22/2010 to current, create two queries instead with the date range set to 01/22/2010 to 12/31/2017 and 01/01/2018 to current respectively.
You can also try reducing your page size in a similar manner.
Report Date Filters
The From/To Date filter for each Report Type above relates to:
- Offences (200): Filters via the Offence Date (when the offence occurred).
- Entities (201): Filters via the Entity Created Date.
- Incidents (202): Filters via the Incident Reported Date.
- Conclusions (203): Filters via the Conclusion Created Date.
- Outcomes (204): Filters via the Outcome Created Date of Outcome Results.
- Task Details (205): Filters via the Task Due Date.
- Running Sheets (207): Filters via the Running Sheet Date.
- Property (208): Filters via the Property Created Date.
- Triage Assessment (209): Filters via the Assessment Created Date.
Connecting Comtrac Statistics Reports to Power BI
The below steps will walk through how to connect Comtrac Statistics Reports to a NEW Power BI Report:
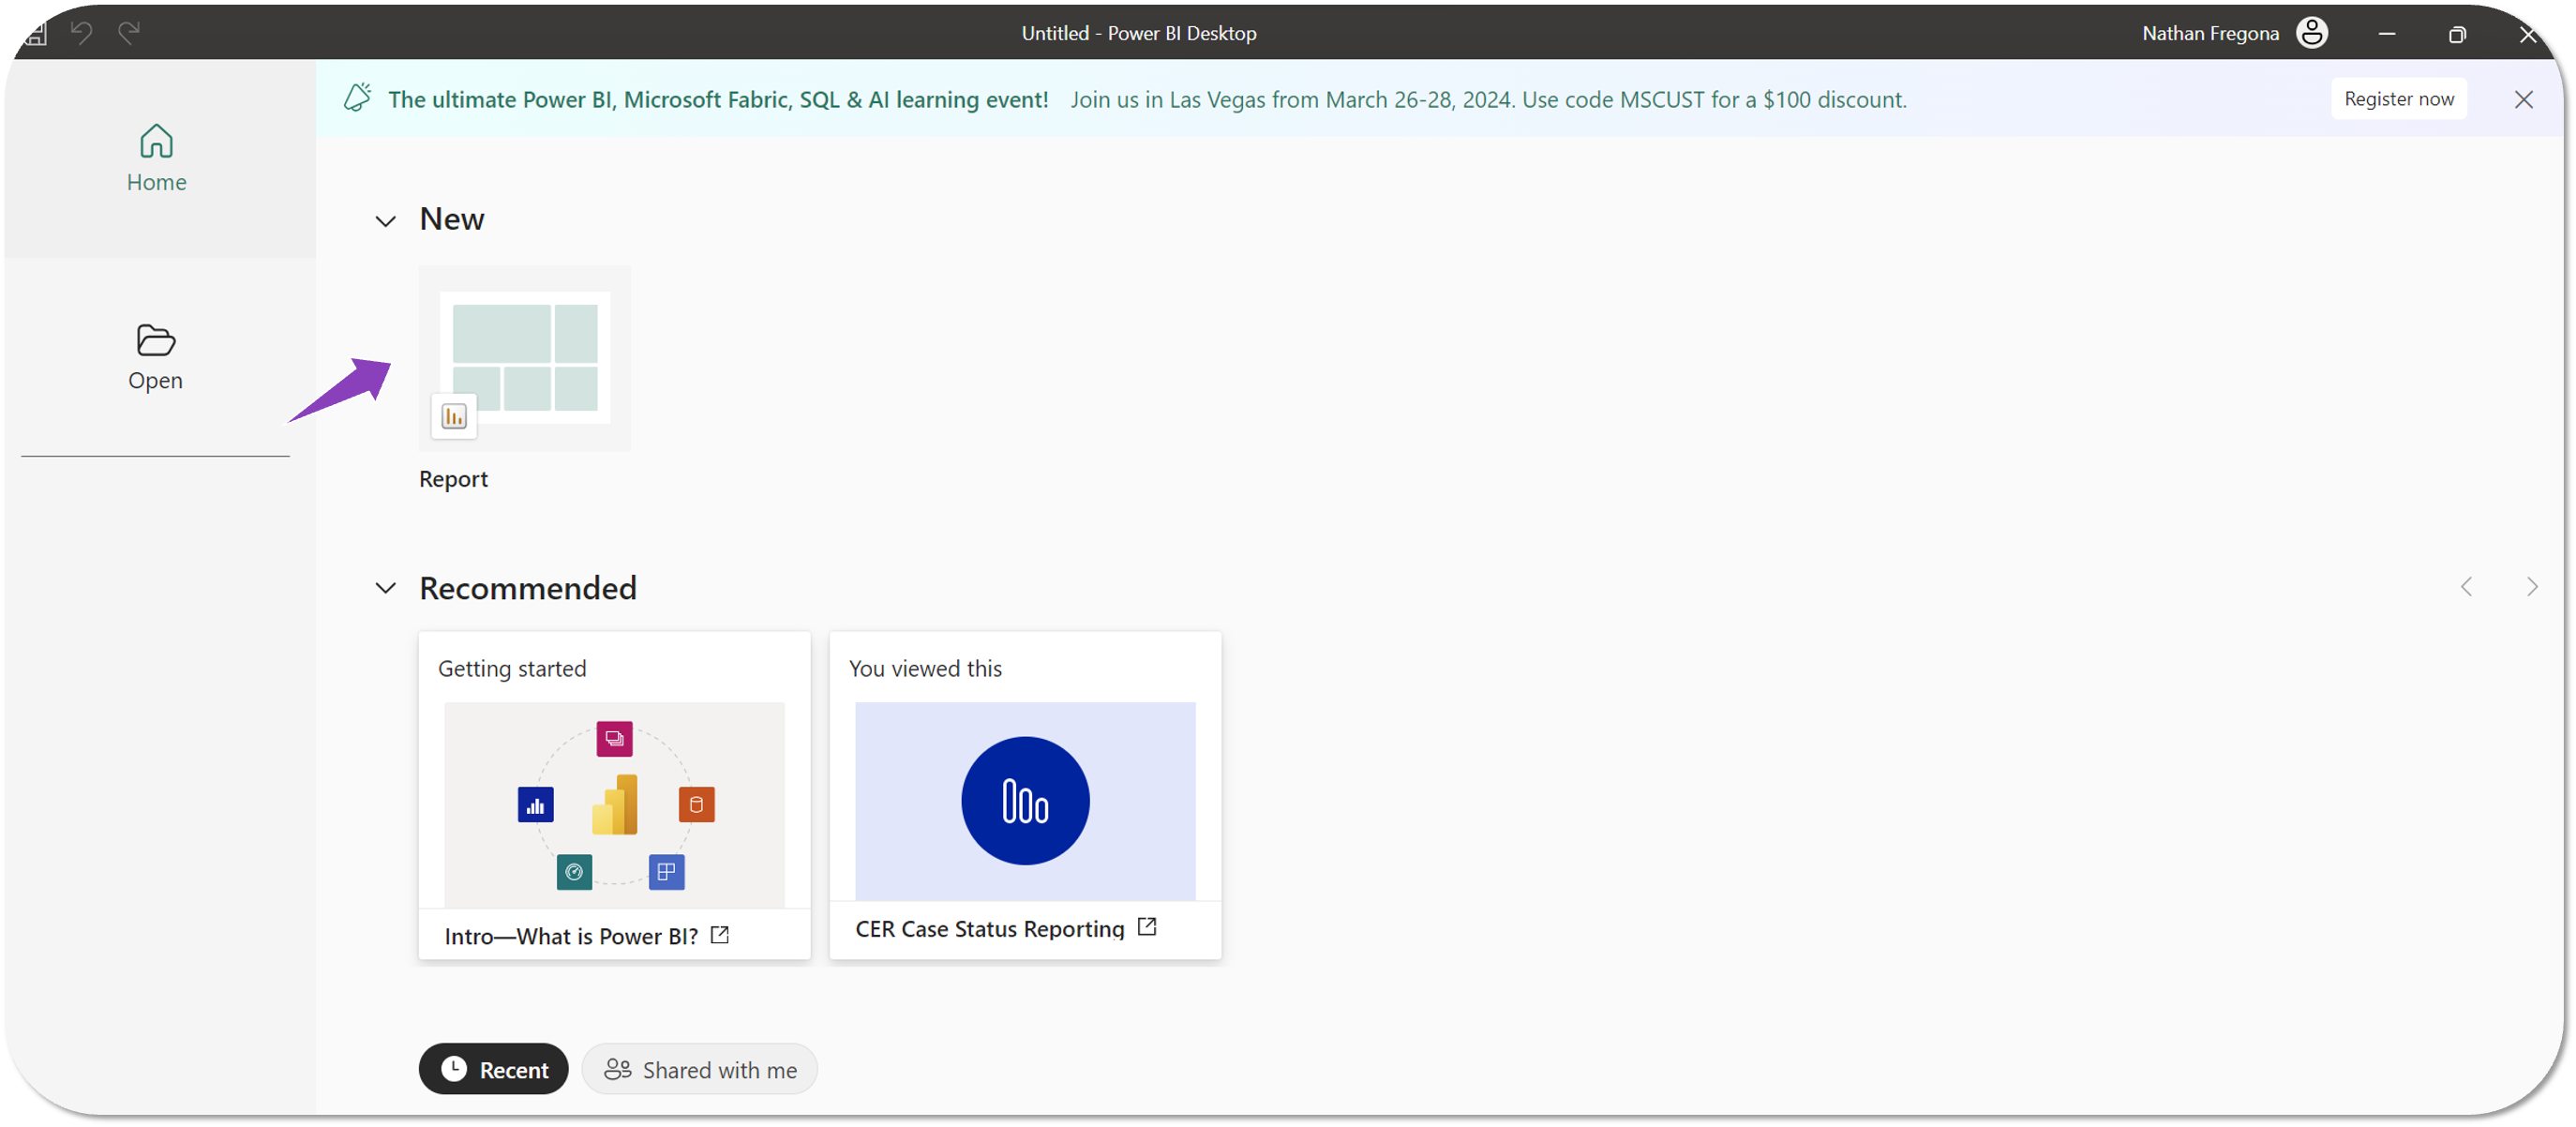
- Open the Power BI Desktop app and Sign-In.
- Select New > Report.

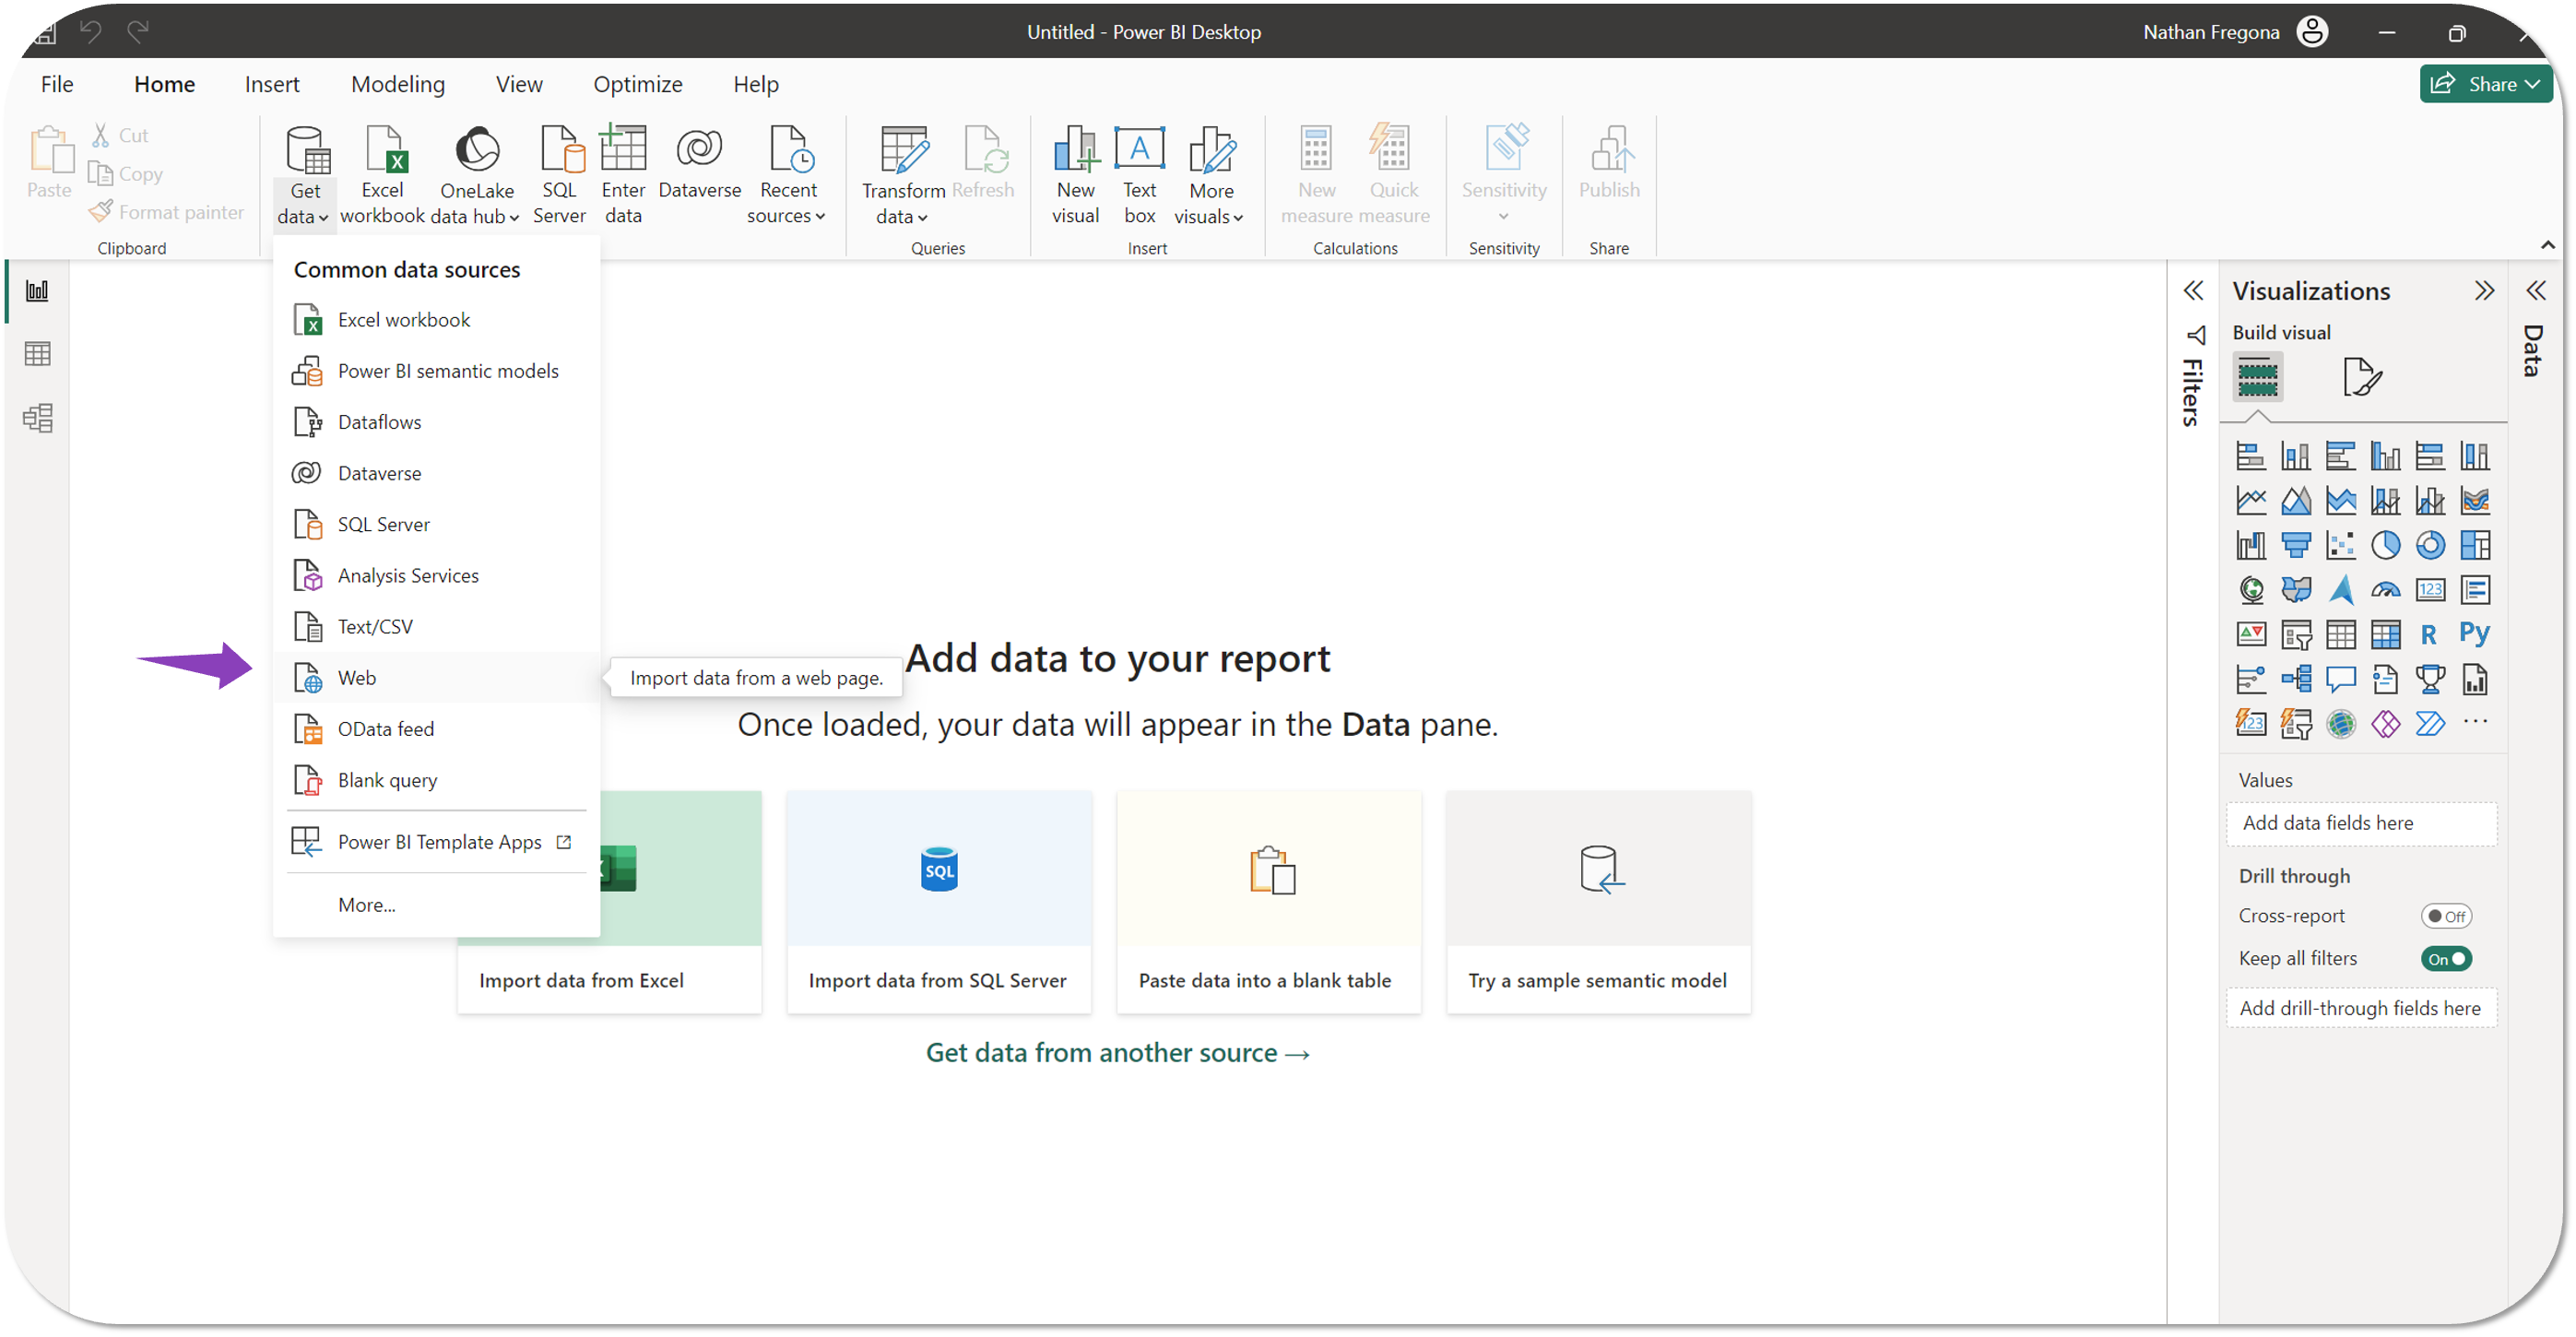
- From the new report, select Get Data > Web.

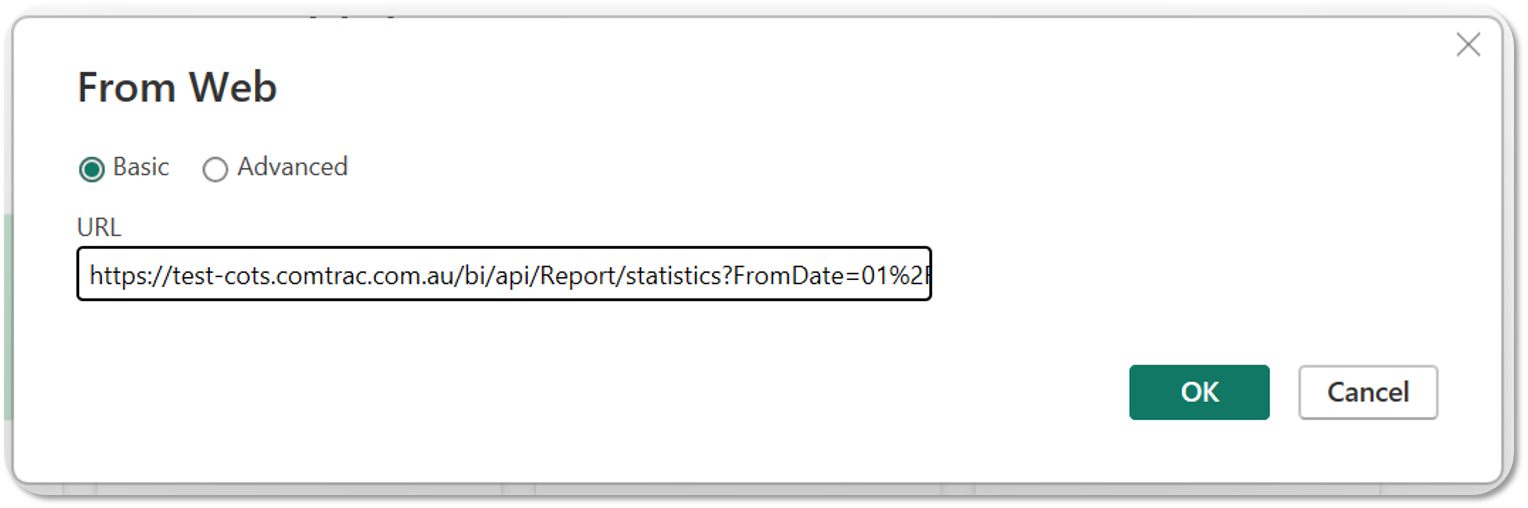
- In the URL field, add in the Comtrac Statistics Report API URL created above and select OK.

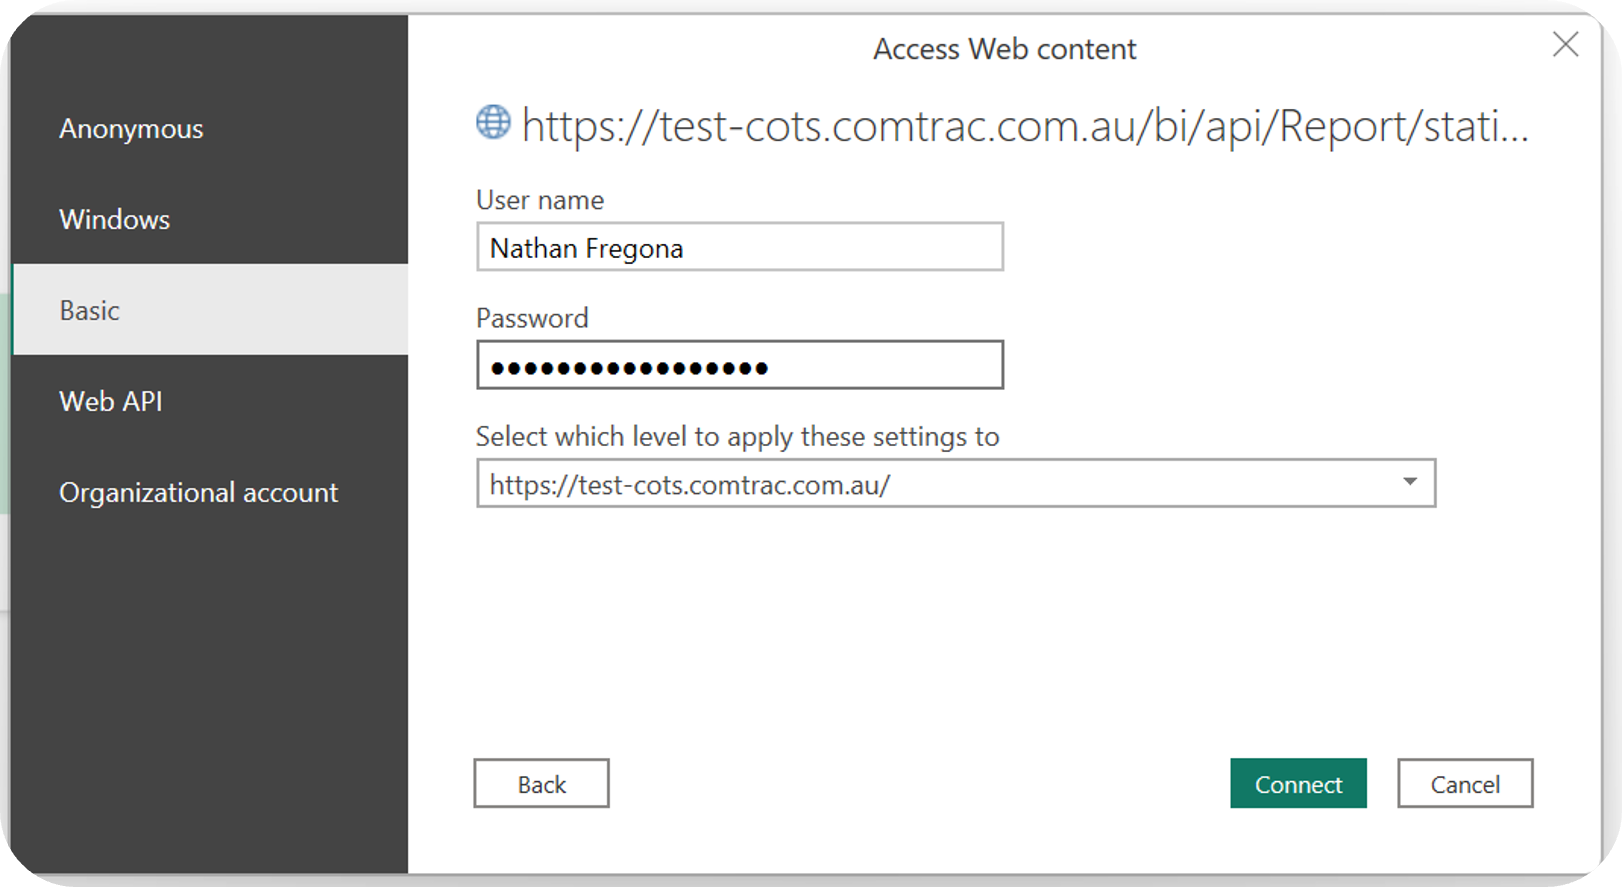
- From the Access Web Content pop-up that appears, navigate to Basic and enter in your Comtrac Username and Password. See the example user below:

- Forgot Comtrac Password: If you have forgotten your Comtrac password or your agency / organisation uses Single-Sign On (SSO) and you've never had to enter a password, a user with Comtrac Admin Access will be able navigate into Comtrac's User Management page to update it for you.
-
Password Reset Caution (SSO Customers): If your organisation or agency has set up SSO to access Comtrac and you reset your Comtrac password, you WILL need to clear all the cookies on your browser before logging back into Comtrac to allow the system to "forget" your old password. You will also need to close any existing windows where Comtrac is open in your browser before opening a new window.
-
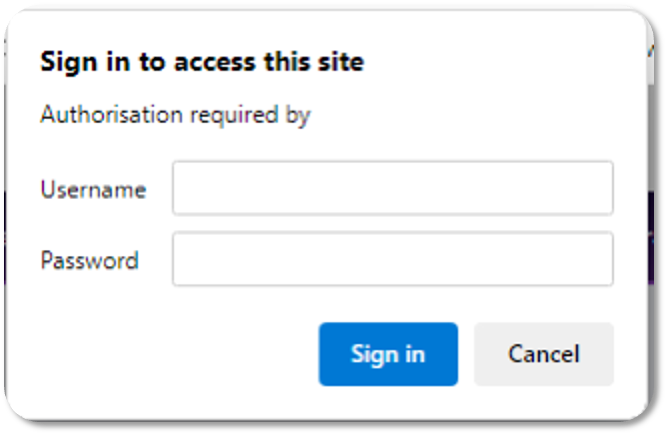
If Comtrac is trying to remember your old password you will be taken to the below pop-up when attempting to access the system. NEVER enter your details in the below sign-in, you will be locked out in doing so. Follow the above steps instead.

-
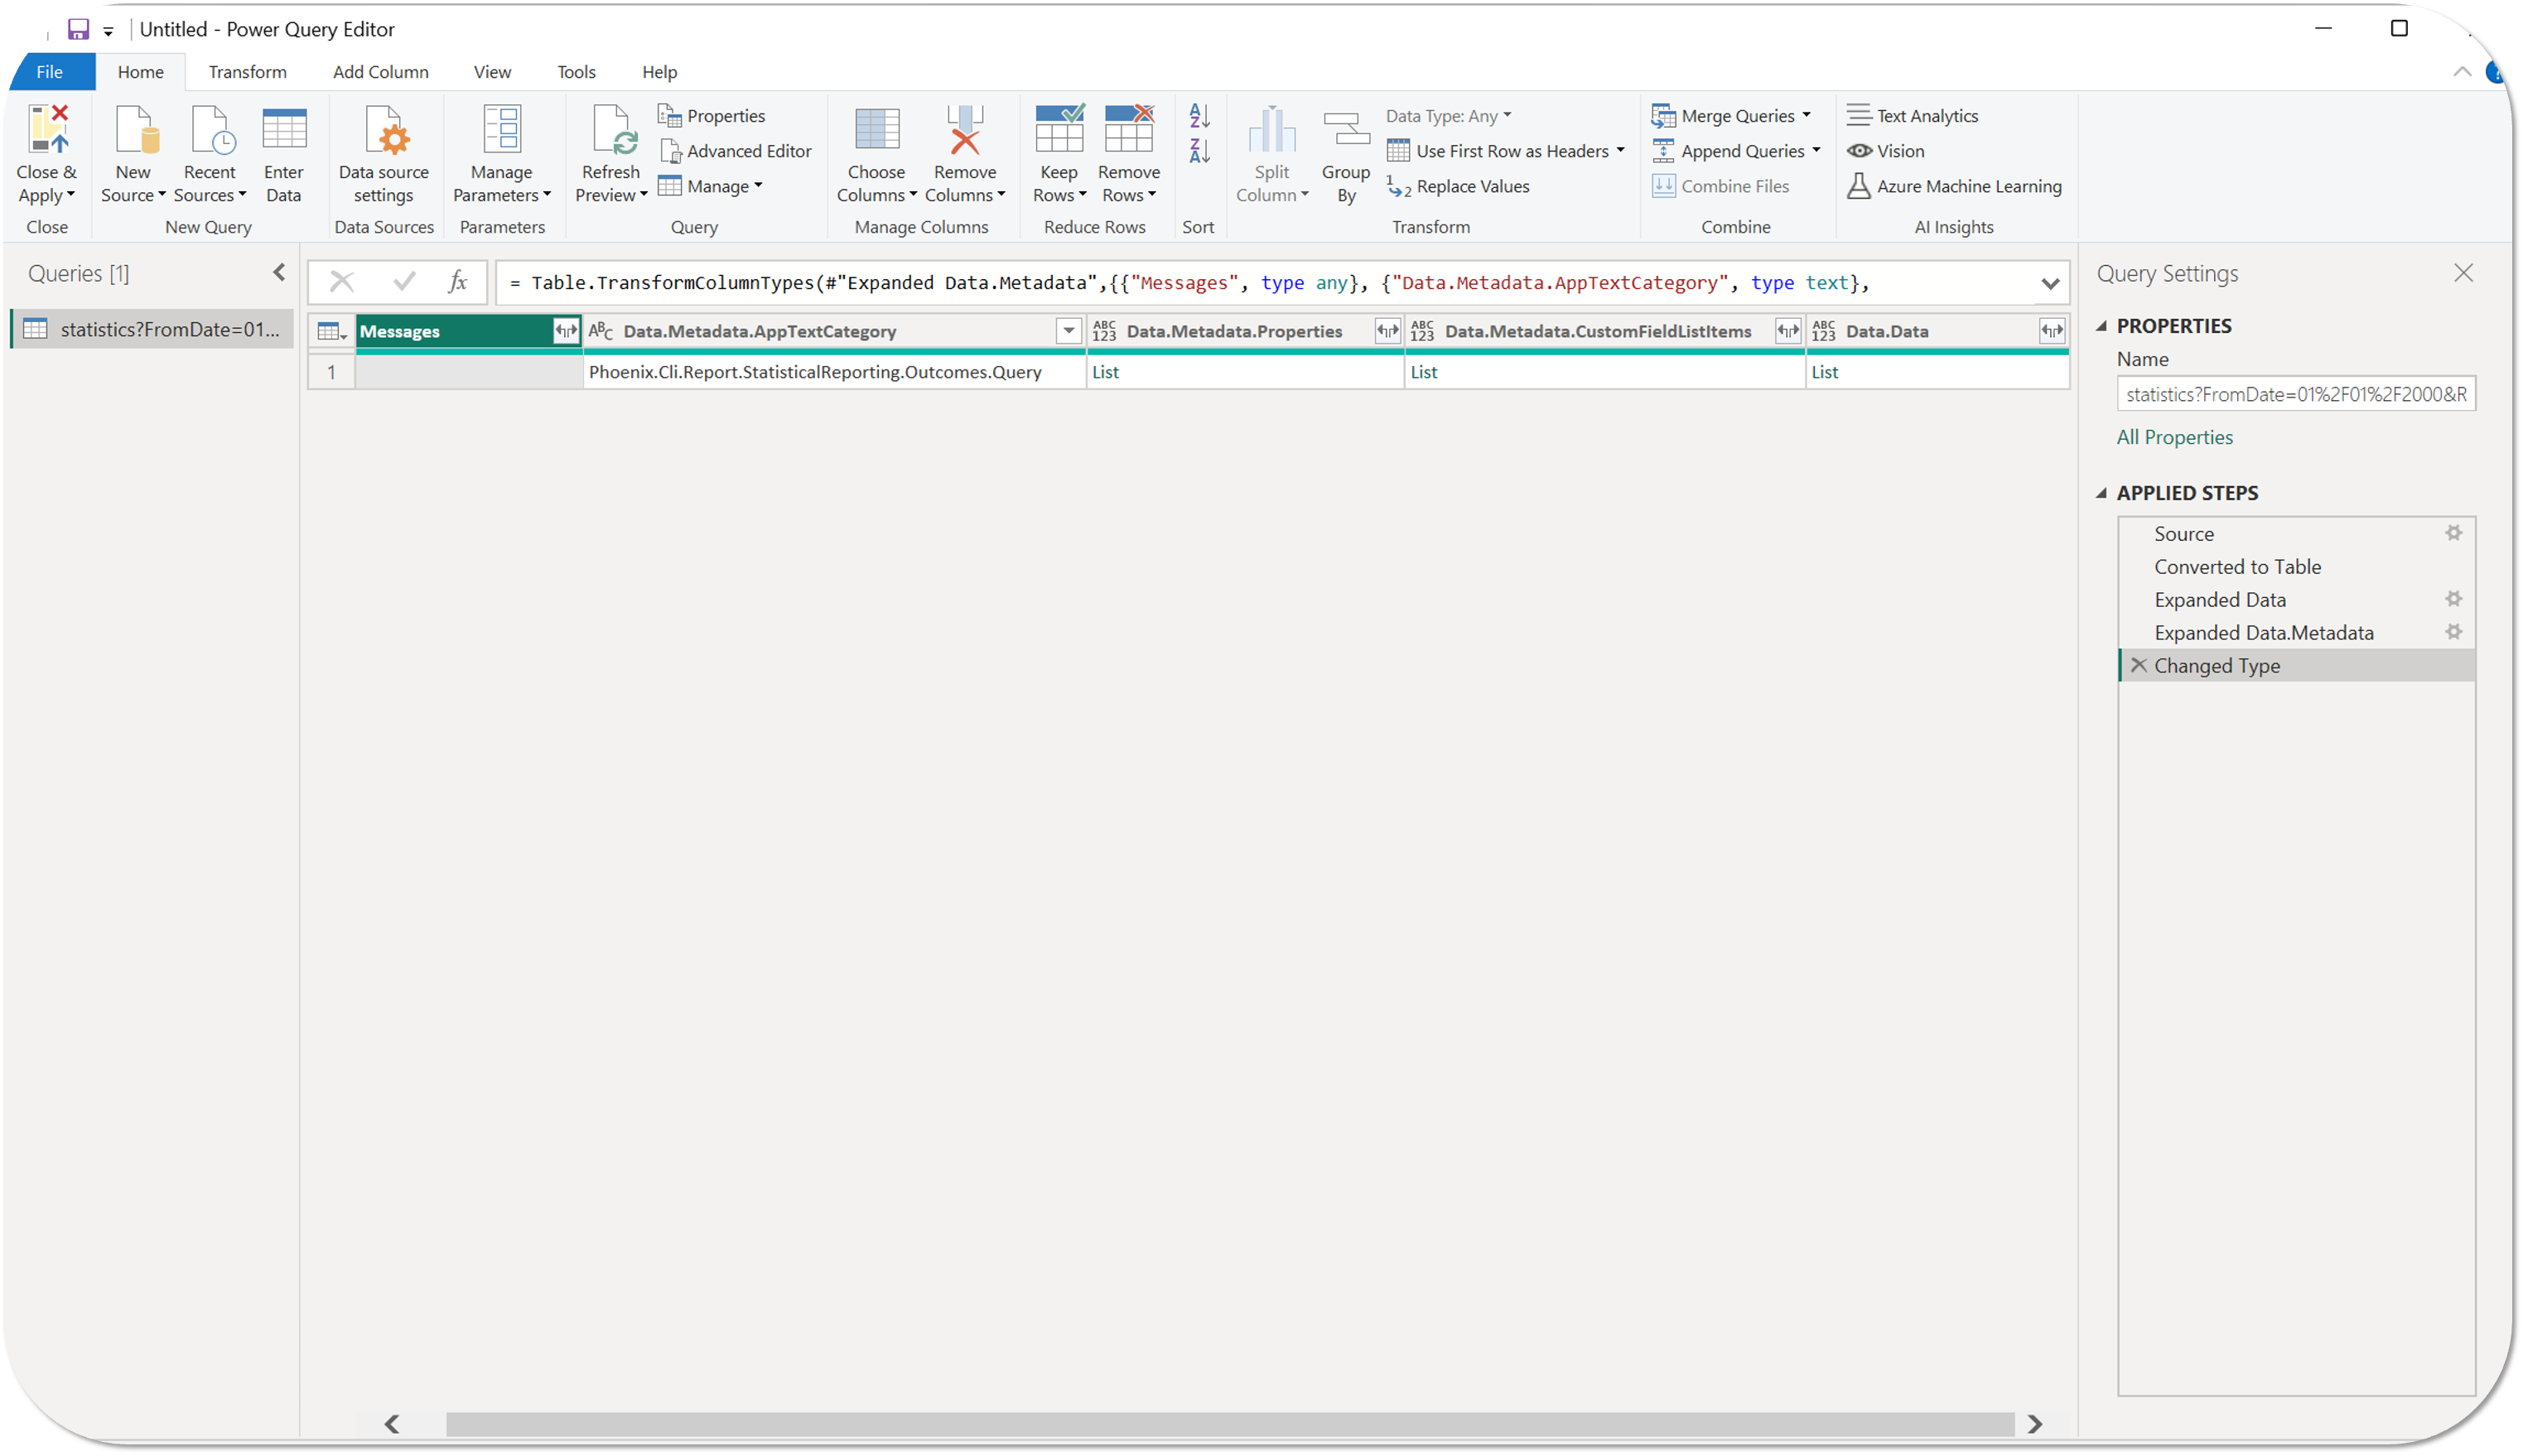
- Select Connect and wait for the Power Query Editor to open automatically with the Comtrac Statistics Report table now connected.

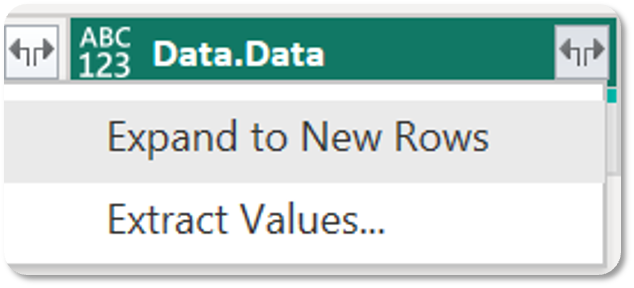
- Select the expand (
 ) icon in the Data.Data column heading of the imported table and then select Expand to New Rows to expand out the list of records in the table.
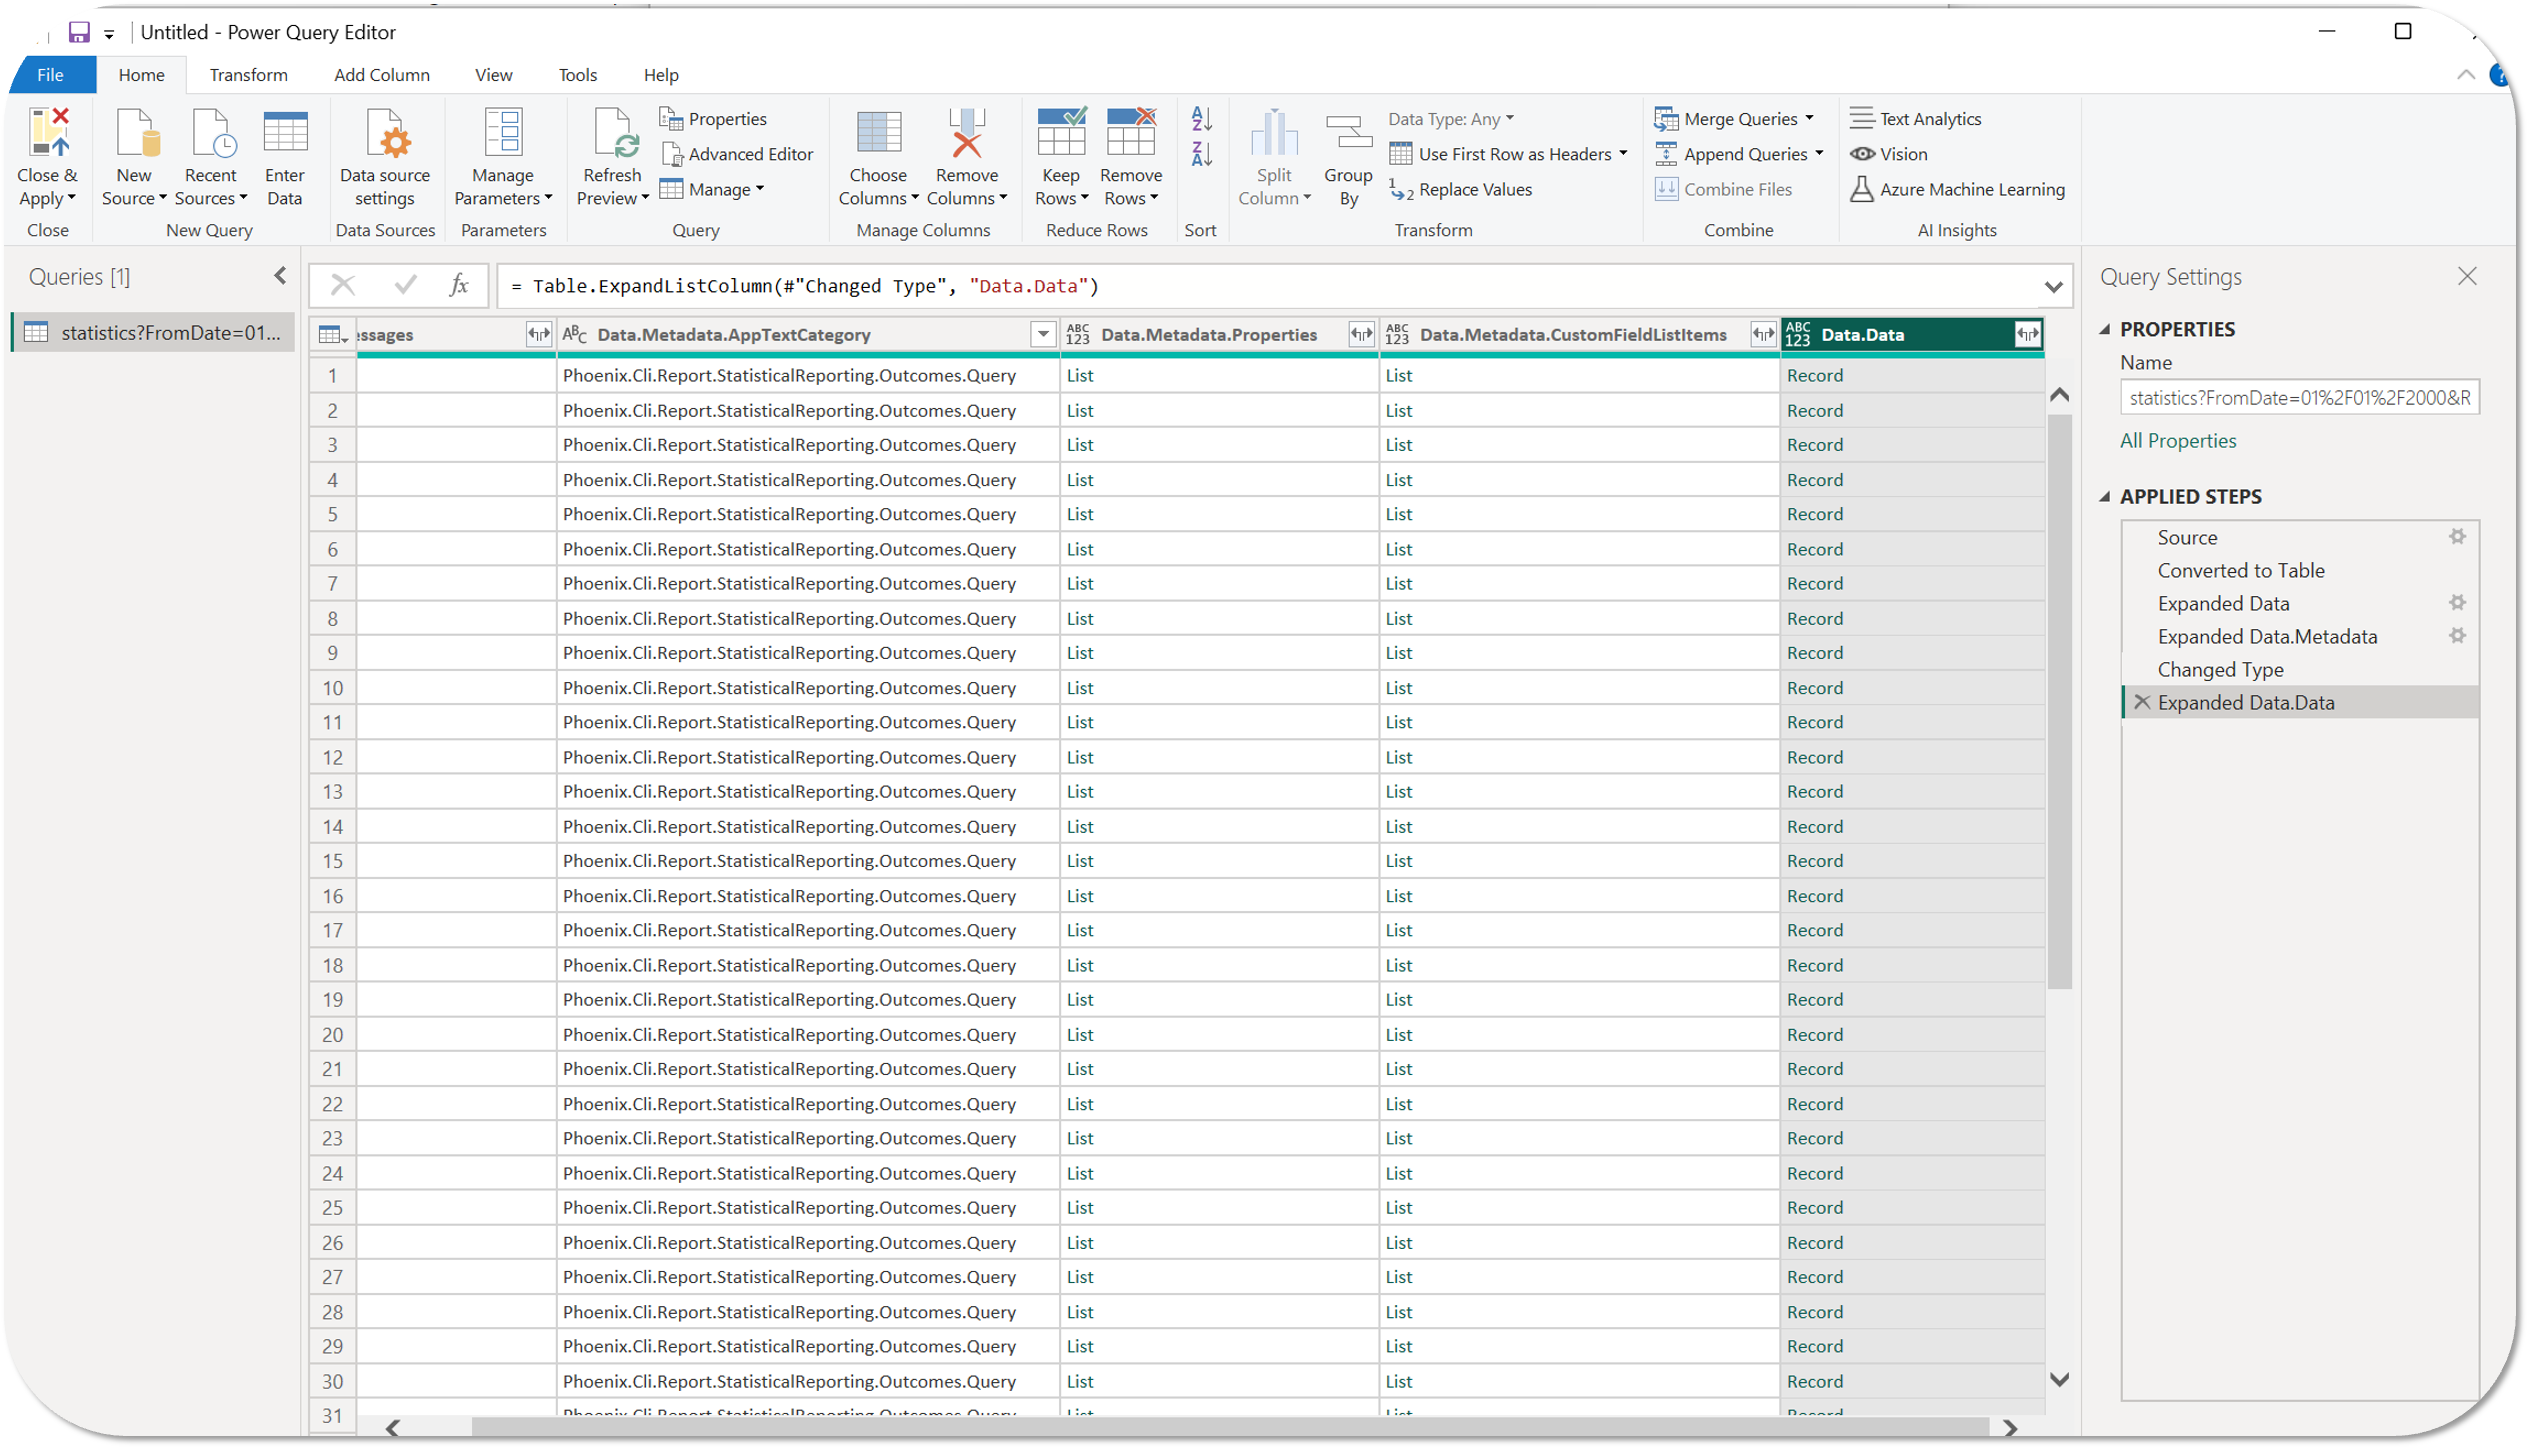
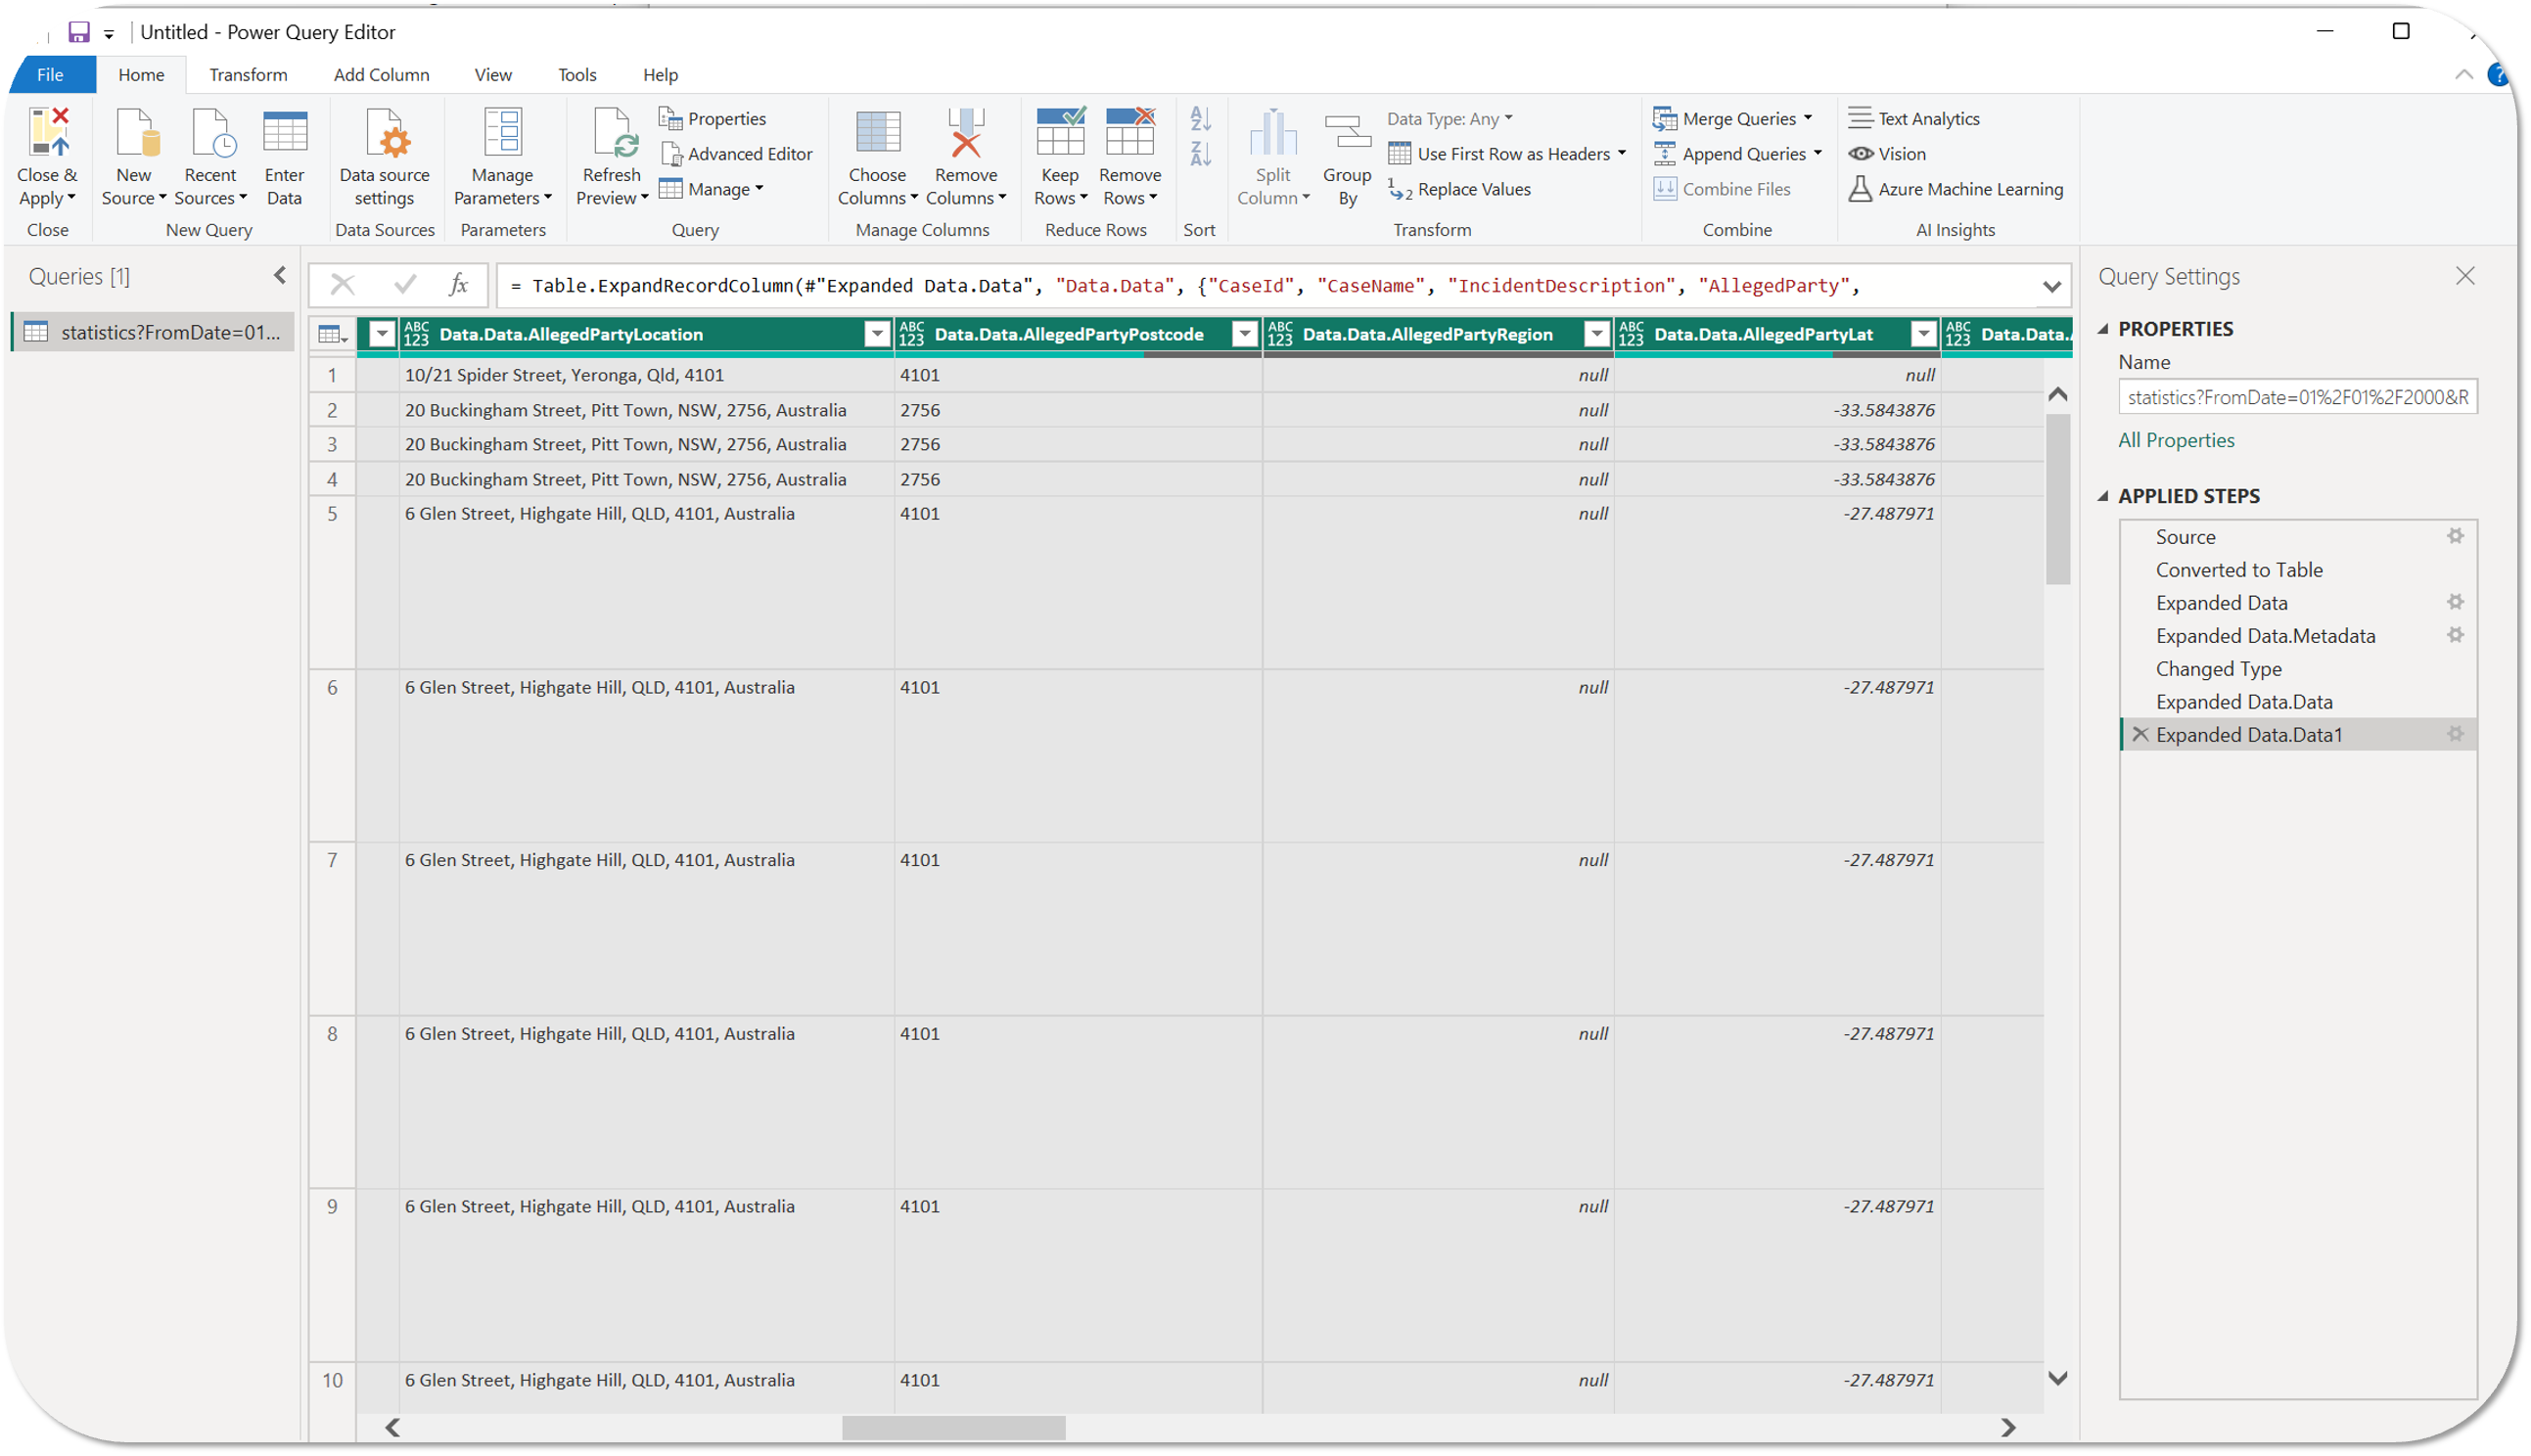
- Your table should now look similar to the below:

- Your table should now look similar to the below:
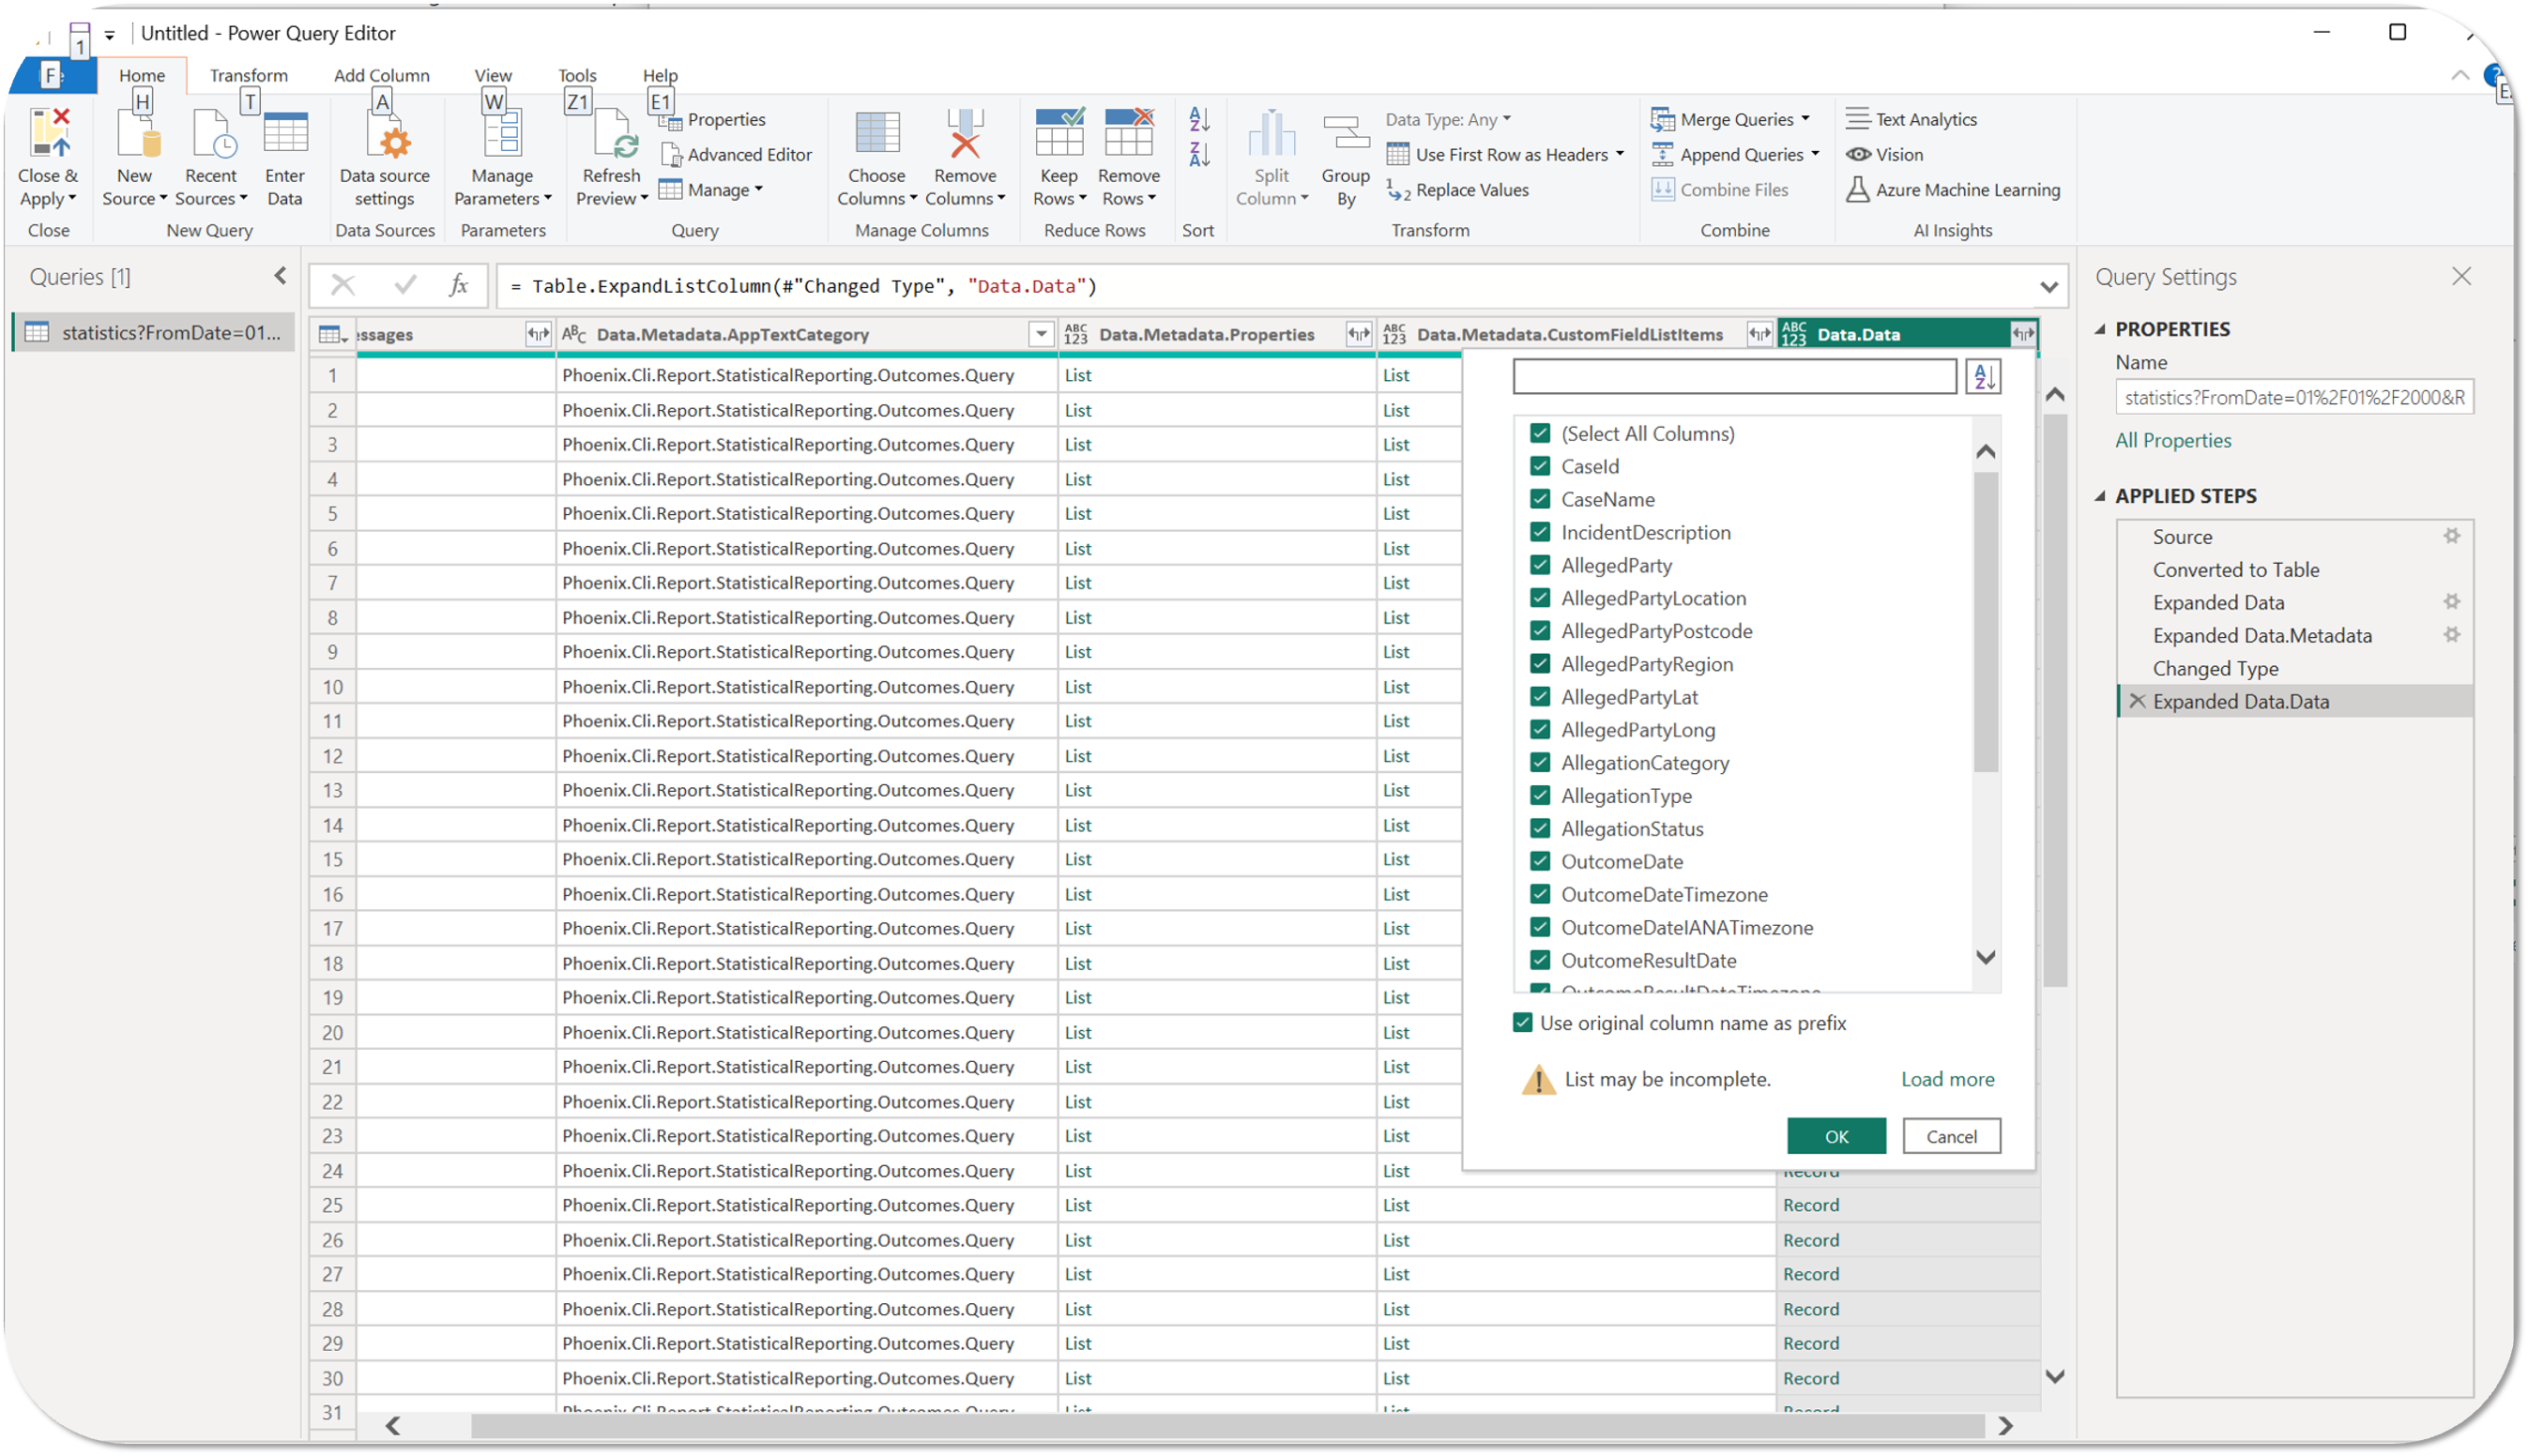
- Select the expand () icon in the Data.Data column heading again which will now show a dropdown list of all record fields that can be displayed from the connected Comtrac Statistics Report.

- NOTE: Uncheck 'Use original column name as prefix' if you don't want 'Data.Data' to appear before each column name, e.g. 'Data.Data.CaseId' becomes just 'CaseId'.
- Choose the fields / columns you want to display and select OK to import all of the selected data.

- Review and transform (edit headings, report name etc.) all of the imported records prior to saving this Power Query if required.
- Check out Microsoft's Guide on transforming data in Power Query Editor for more details.
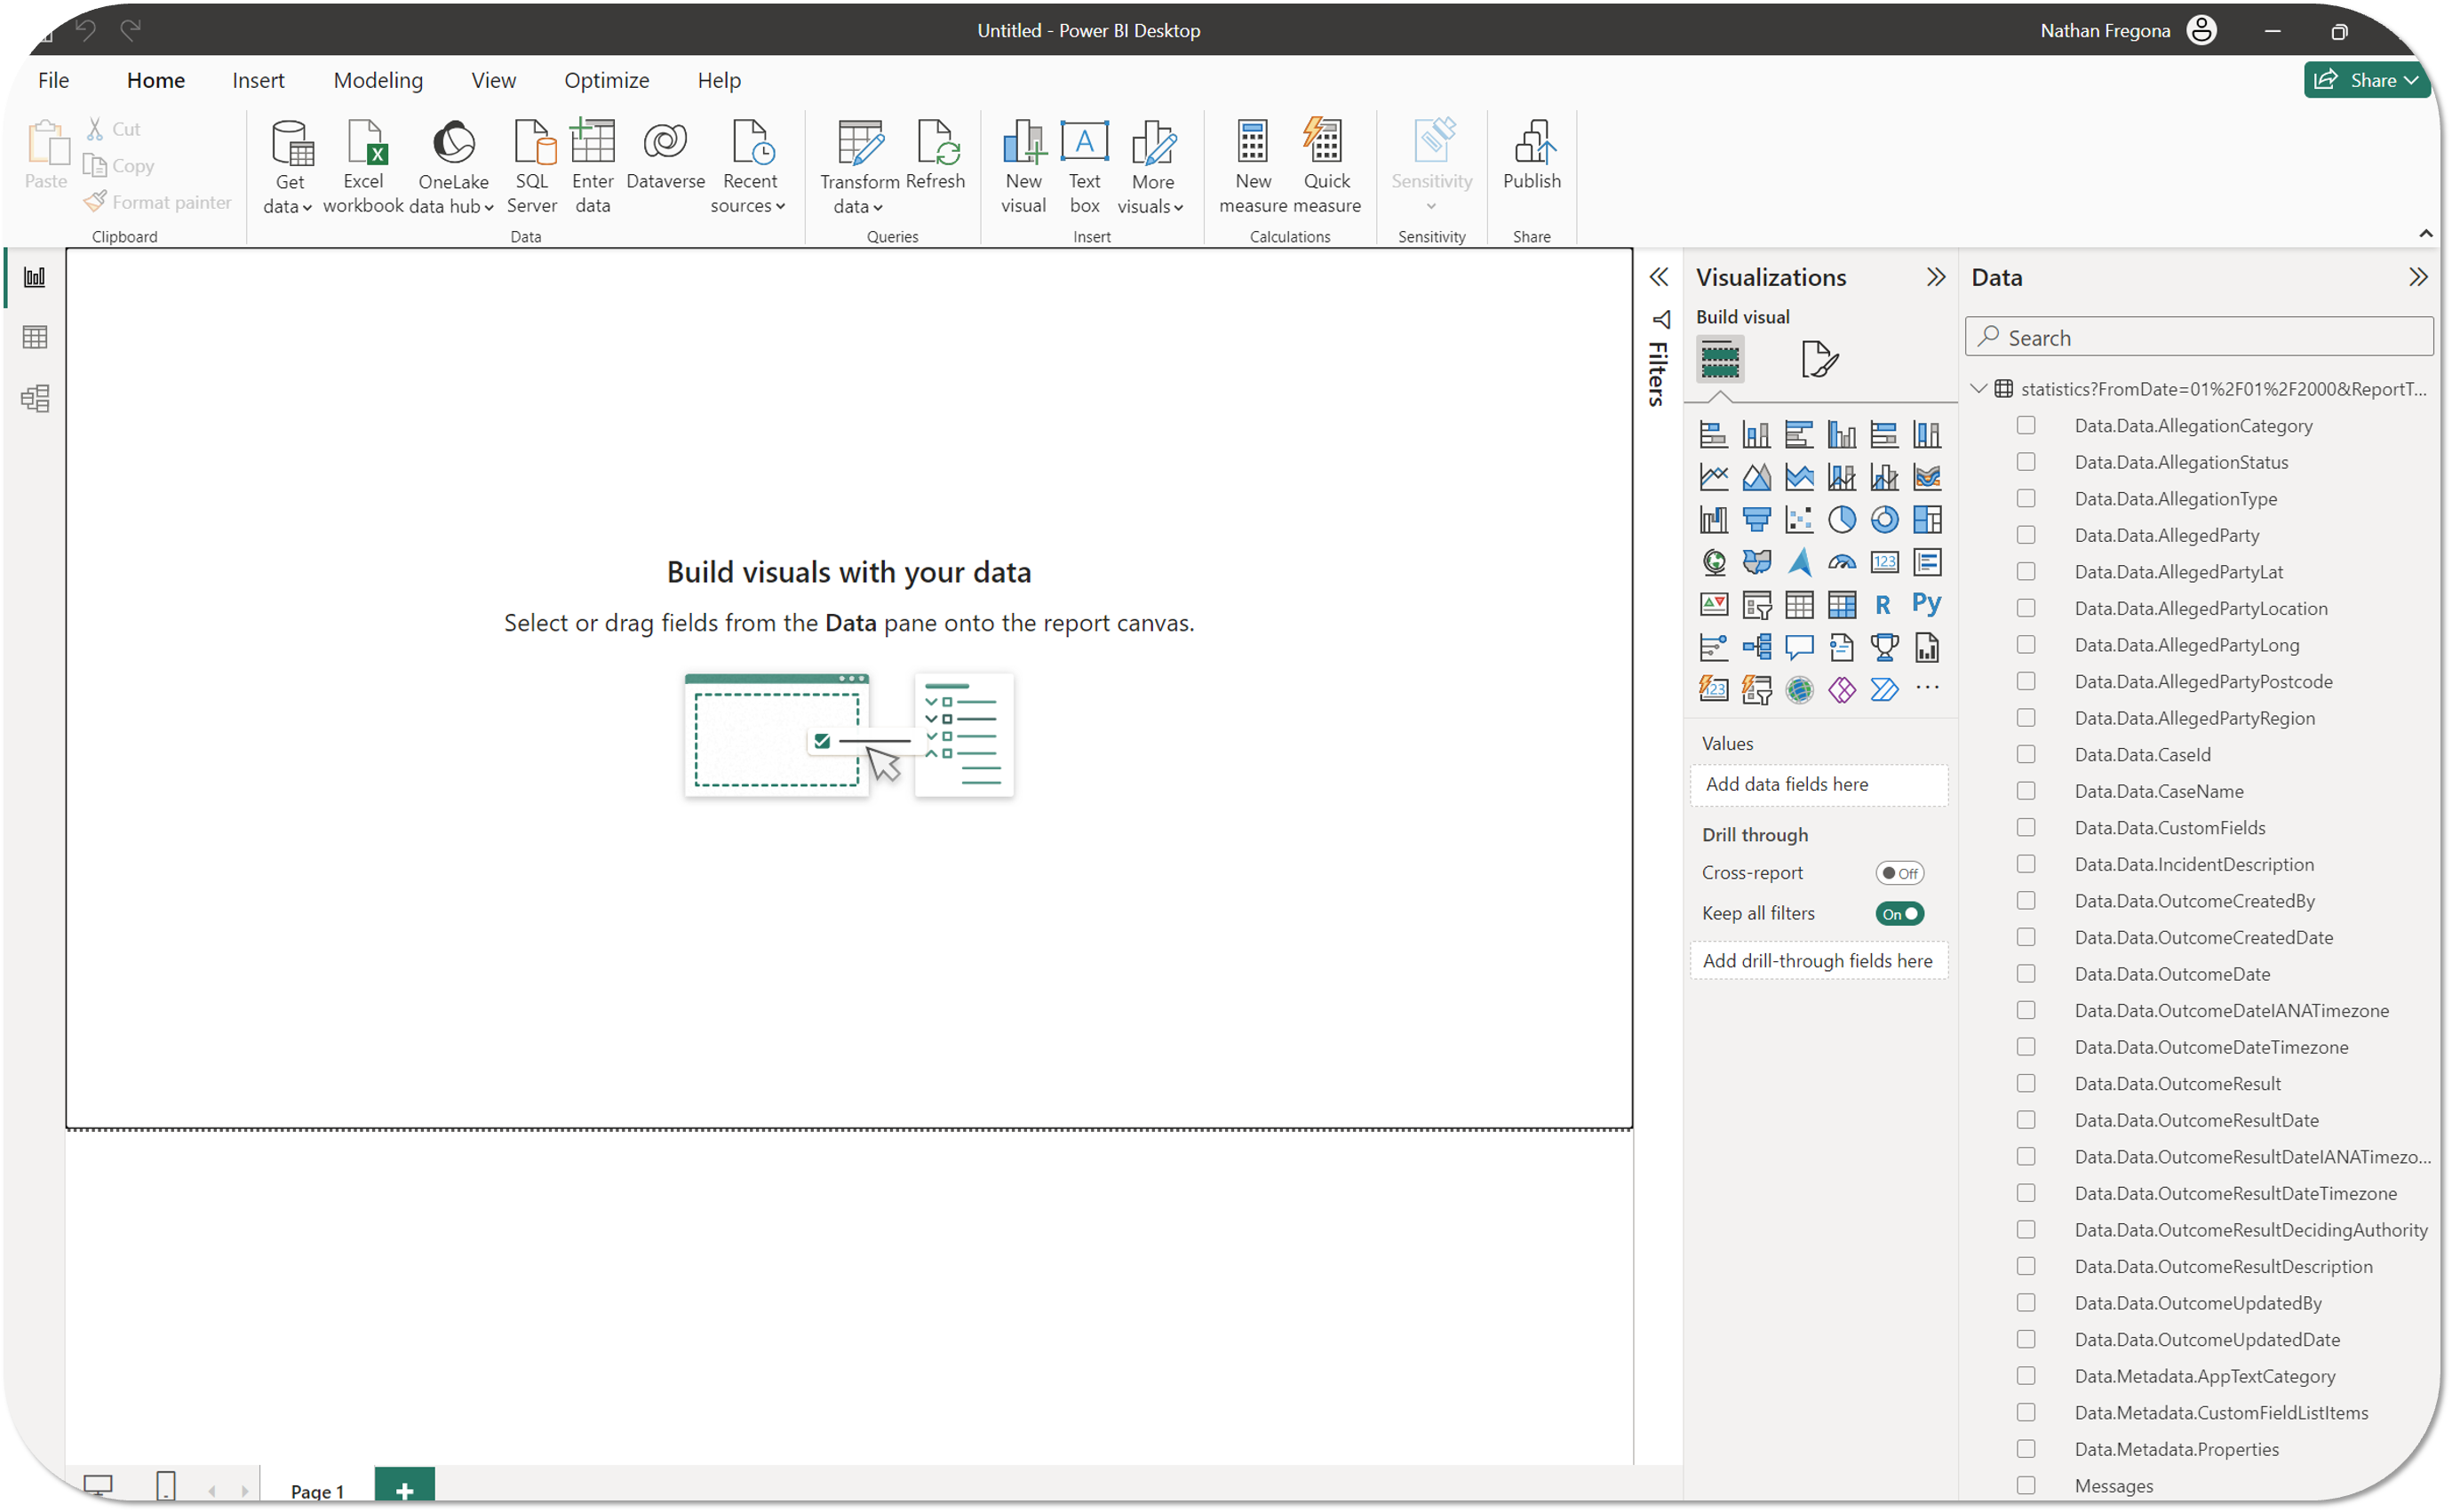
- Once you're happy with the data, select Close & Apply to add the Comtrac Statistics Report to your Power BI report template.

- From here you can start to build out and design your Power BI reports and templates using the connected Comtrac data.
- To understand how to connect multiple Comtrac Statistics Reports and automatically refresh report data, refer to the NEXT STEPS section of this guide.
Microsoft Learn:
Data Security: Connected Comtrac Stastics Reports in Power BI will ONLY show data that you have access to in Comtrac itself.
NEXT STEPS
Connecting Multiple Comtrac Stastics Reports to a Power BI Report
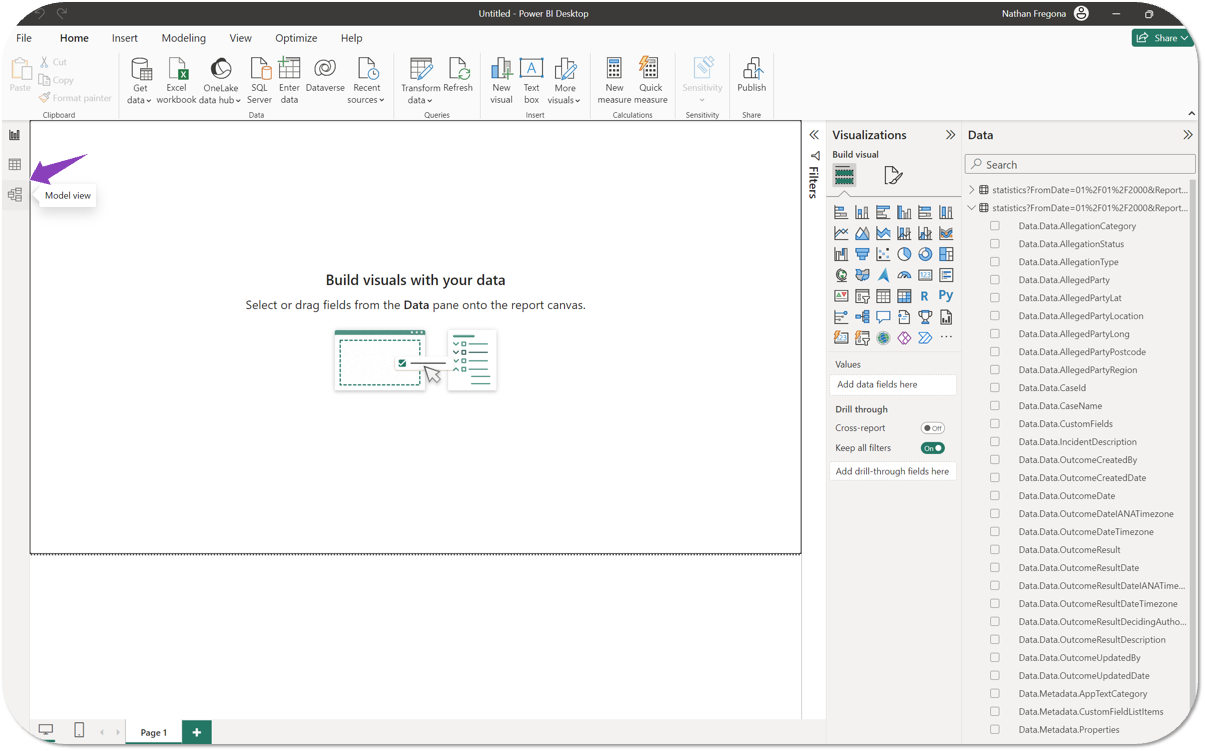
- From an existing Power BI report select Get Data > Web and follow the above steps to connect another Comtrac Statistics Report to it.
- Once completed, select the Data Model icon (
 ) to add a relationship between the two (or more) Comtrac Statistics Reports that have been connected.
- NOTE: Adding a relationship allows meaningful insights to be drawn from across these multiple reports (in tables, graphs, charts and other visuals).
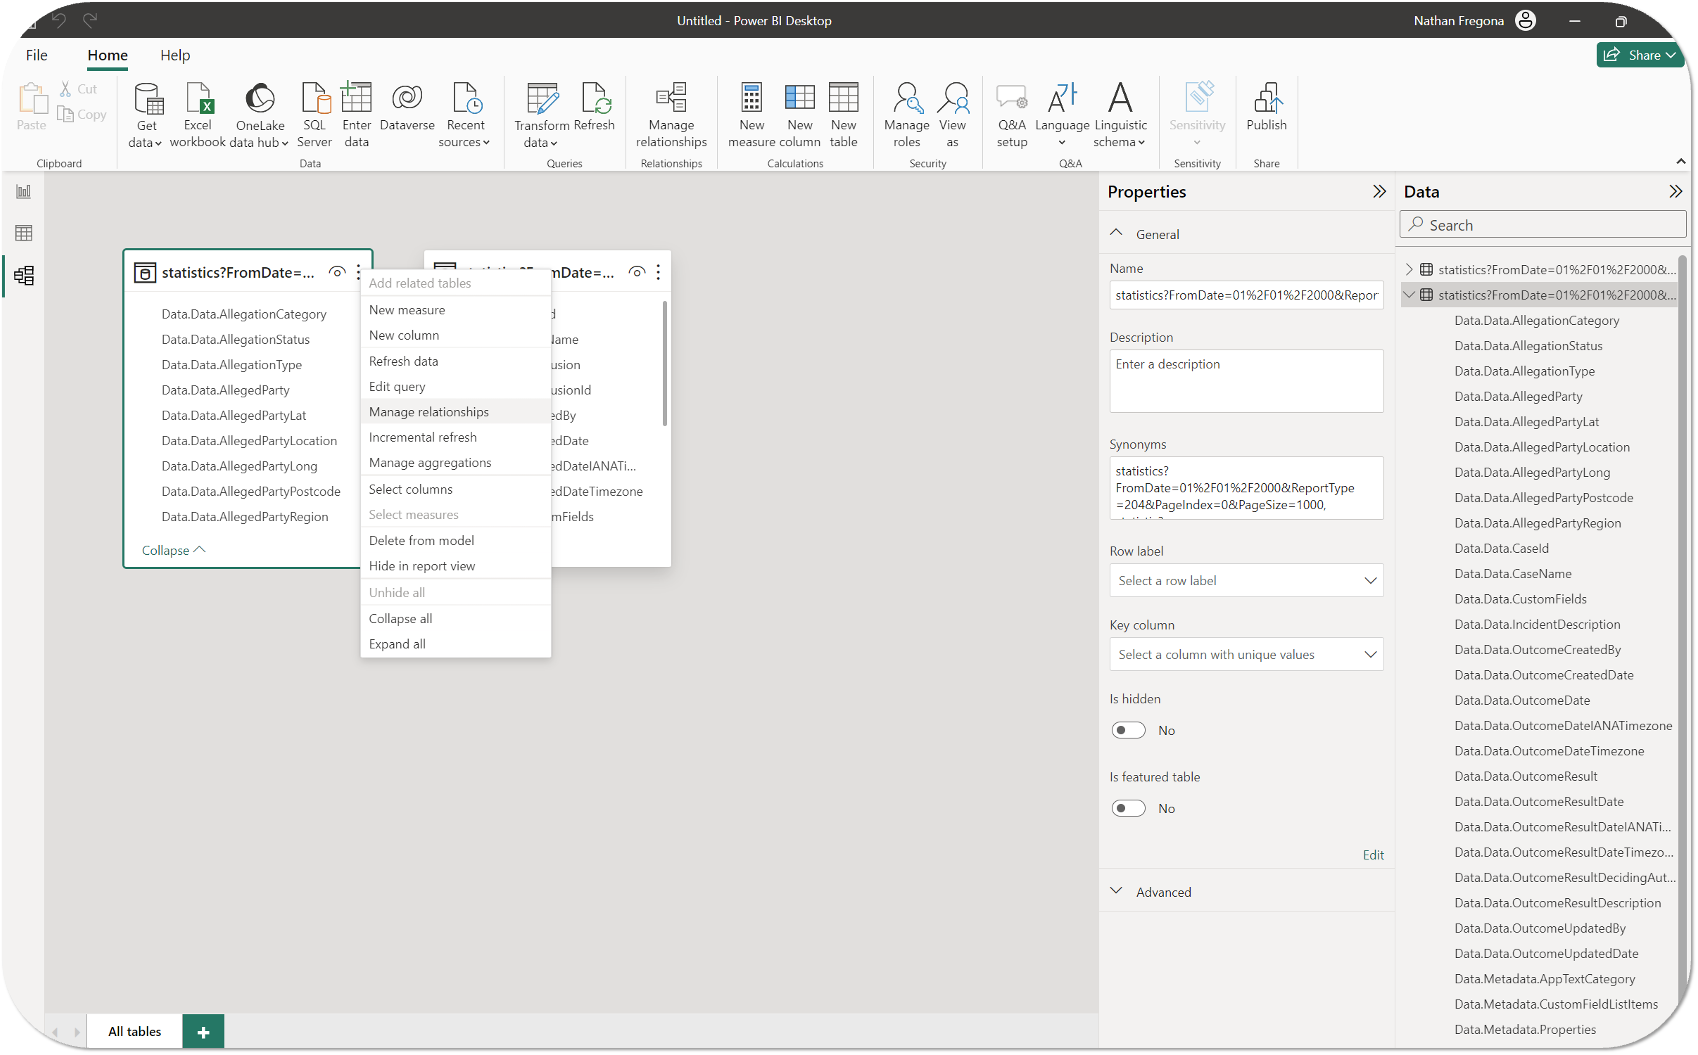
- Select the ellipsis (
 ) icon against the heading of one of the Comtrac Statistics Reports and navigate to Manage Relationships.
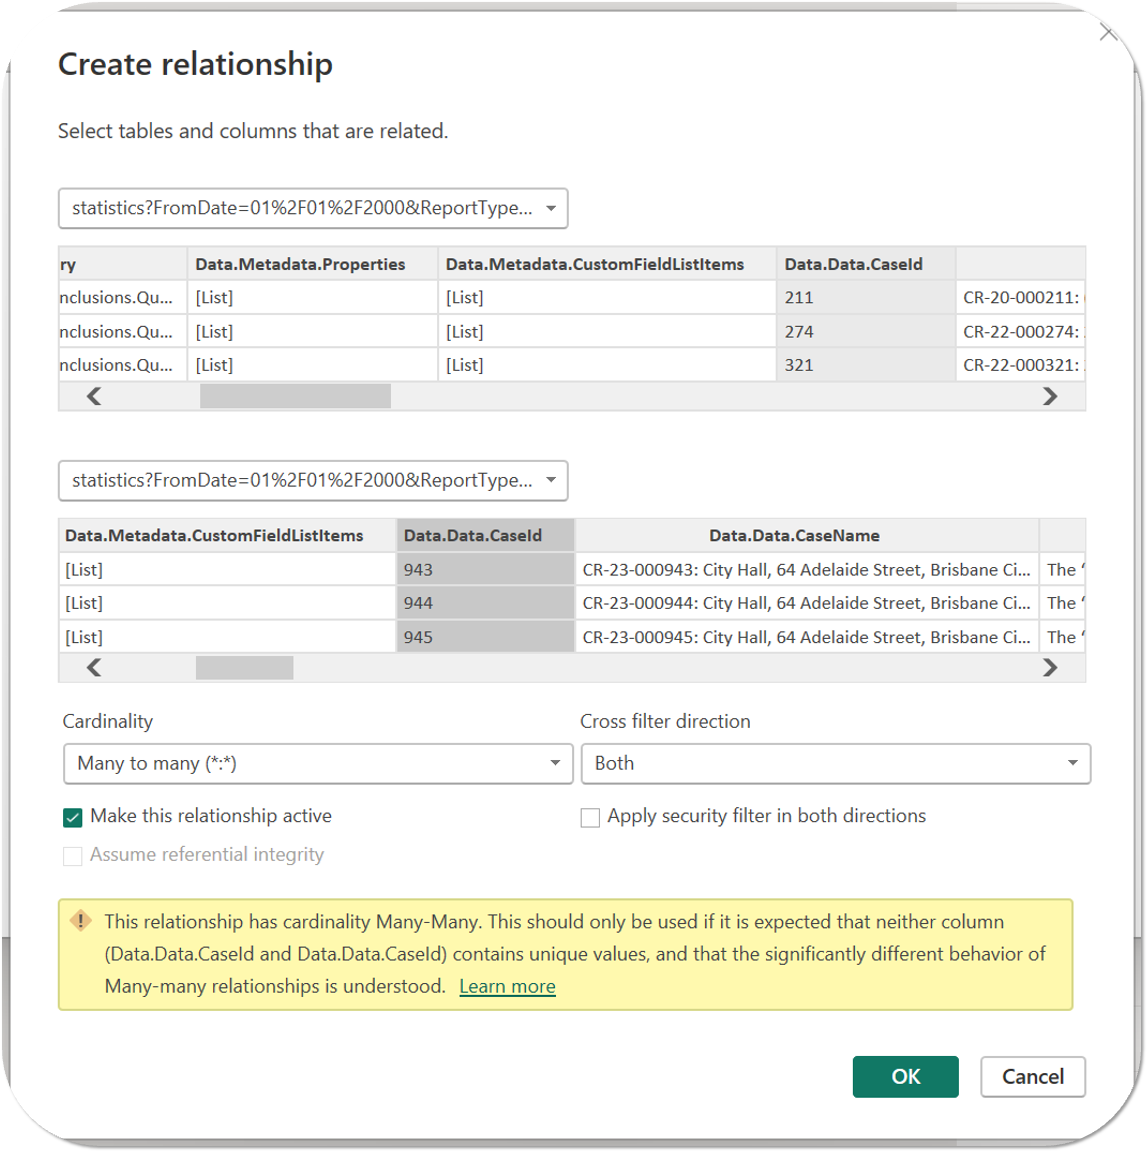
- In the Create Relationship pop-up, select two Comtrac Statistics Reports (i.e. Conclusions and Outcomes) in the drop-down fields and highlight the Caseid data column in each report to add a relationship between them. A mandatory many-to-many relationship will be automatically set in the cardinality field. Ensure the cross filter direction is also set to both.

- NOTE: Caseid is the recommend data column to add a relationship between as it is database generated, CAN'T be edited, and appears on EVERY Comtrac Statistics Report.
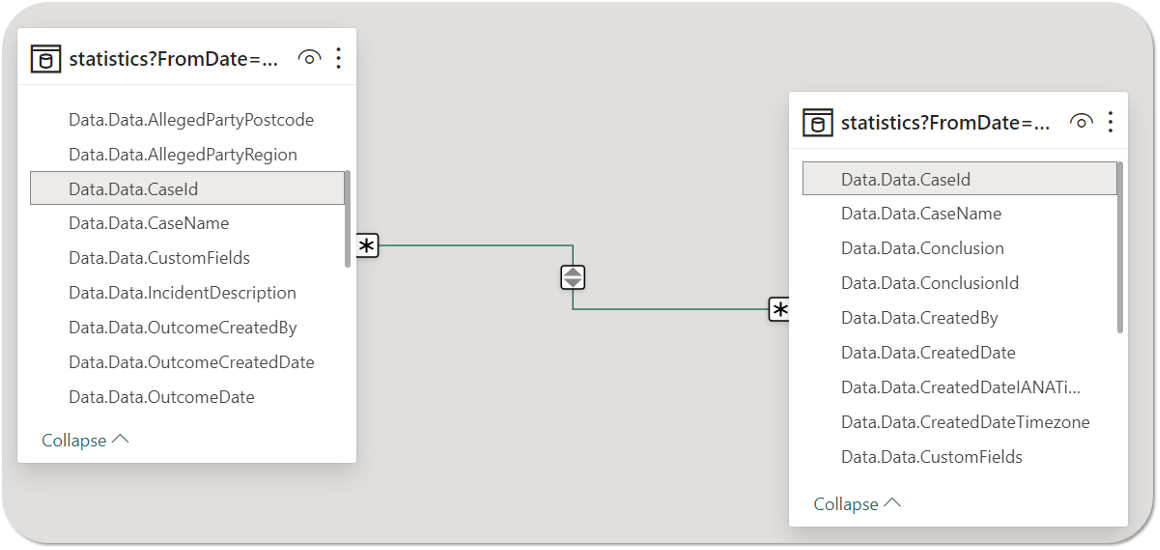
- Select OK to add the relationship to your Power BI report to beging building out visuals and templates. The relationship will appear similar to the below:

Microsoft Learn:
Automatically Refresh Power BI Report Data
With your Comtrac Statistics Report connected to Power BI, you can choose to automatically refresh the reports data on a daily or weekly basis to keep reports up to date. To do so:
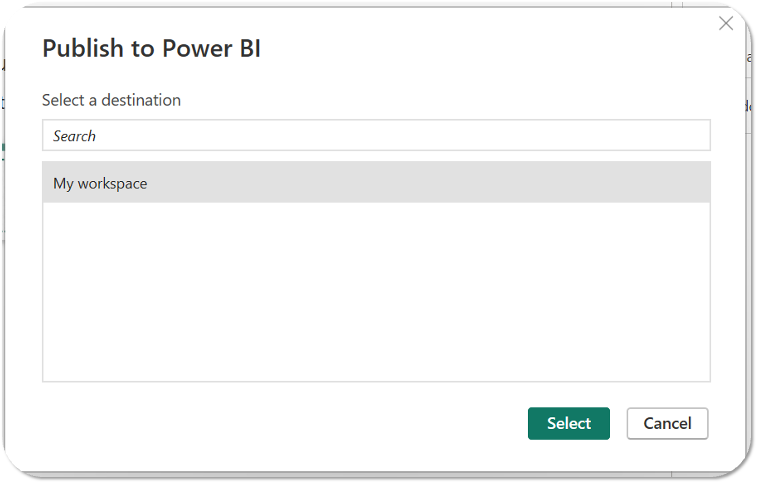
- Publish your Power BI report to a desired workspace (My workspace or Organizational).

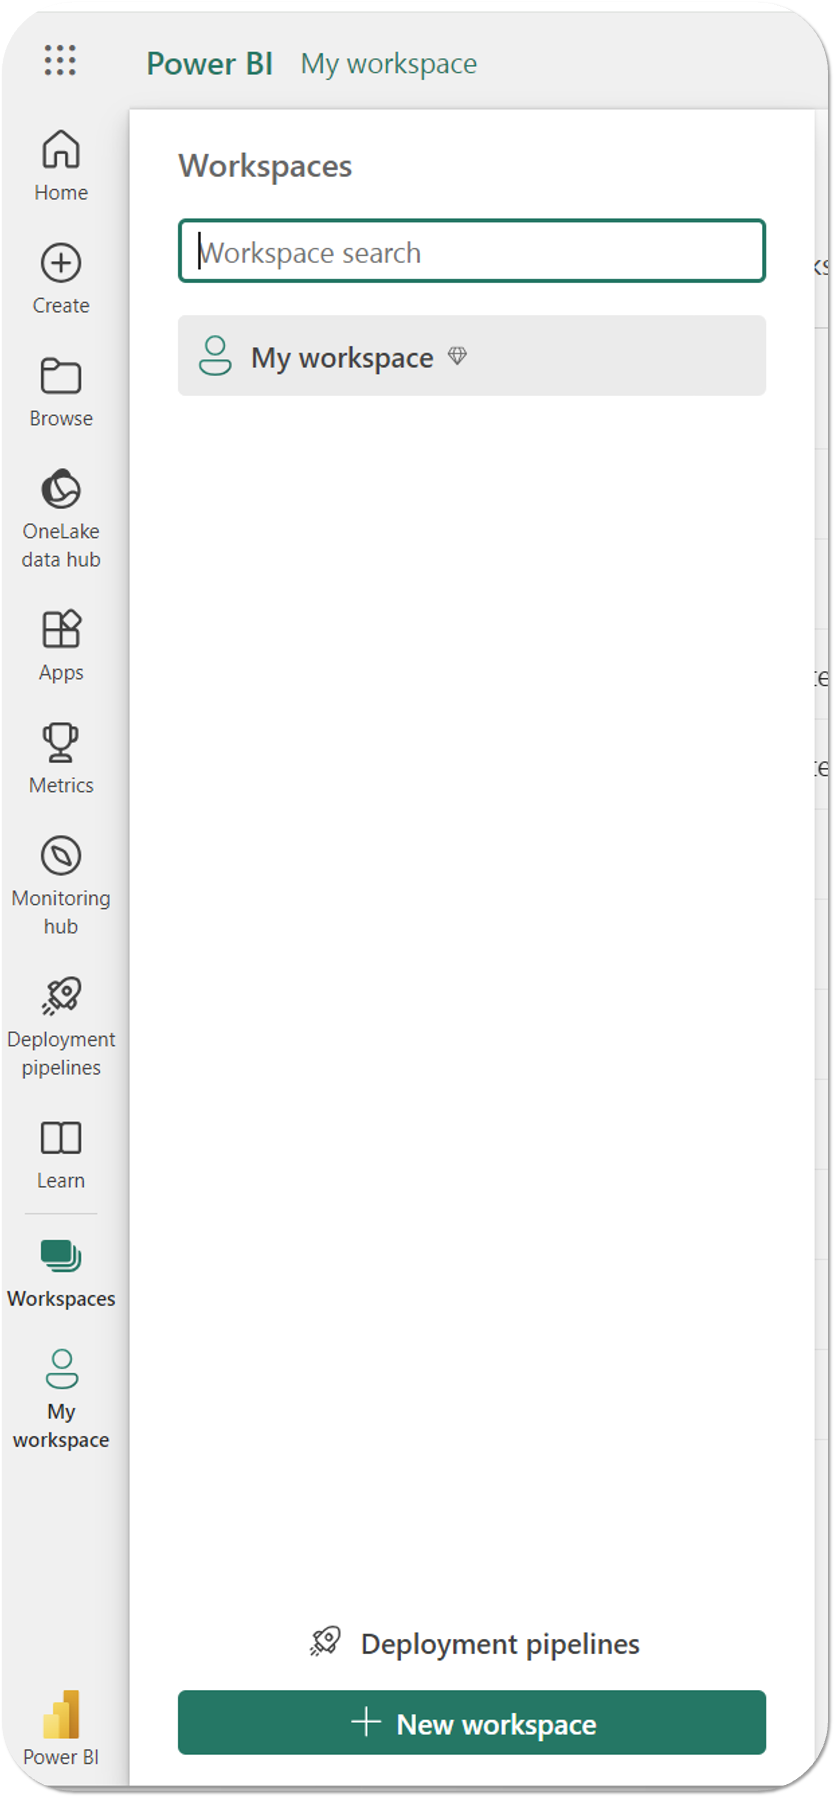
- Sign-in to the Power BI app (app.powerbi.com) on your browser to access your workspaces.
- Select Workspaces and choose the workspace you published your report into.

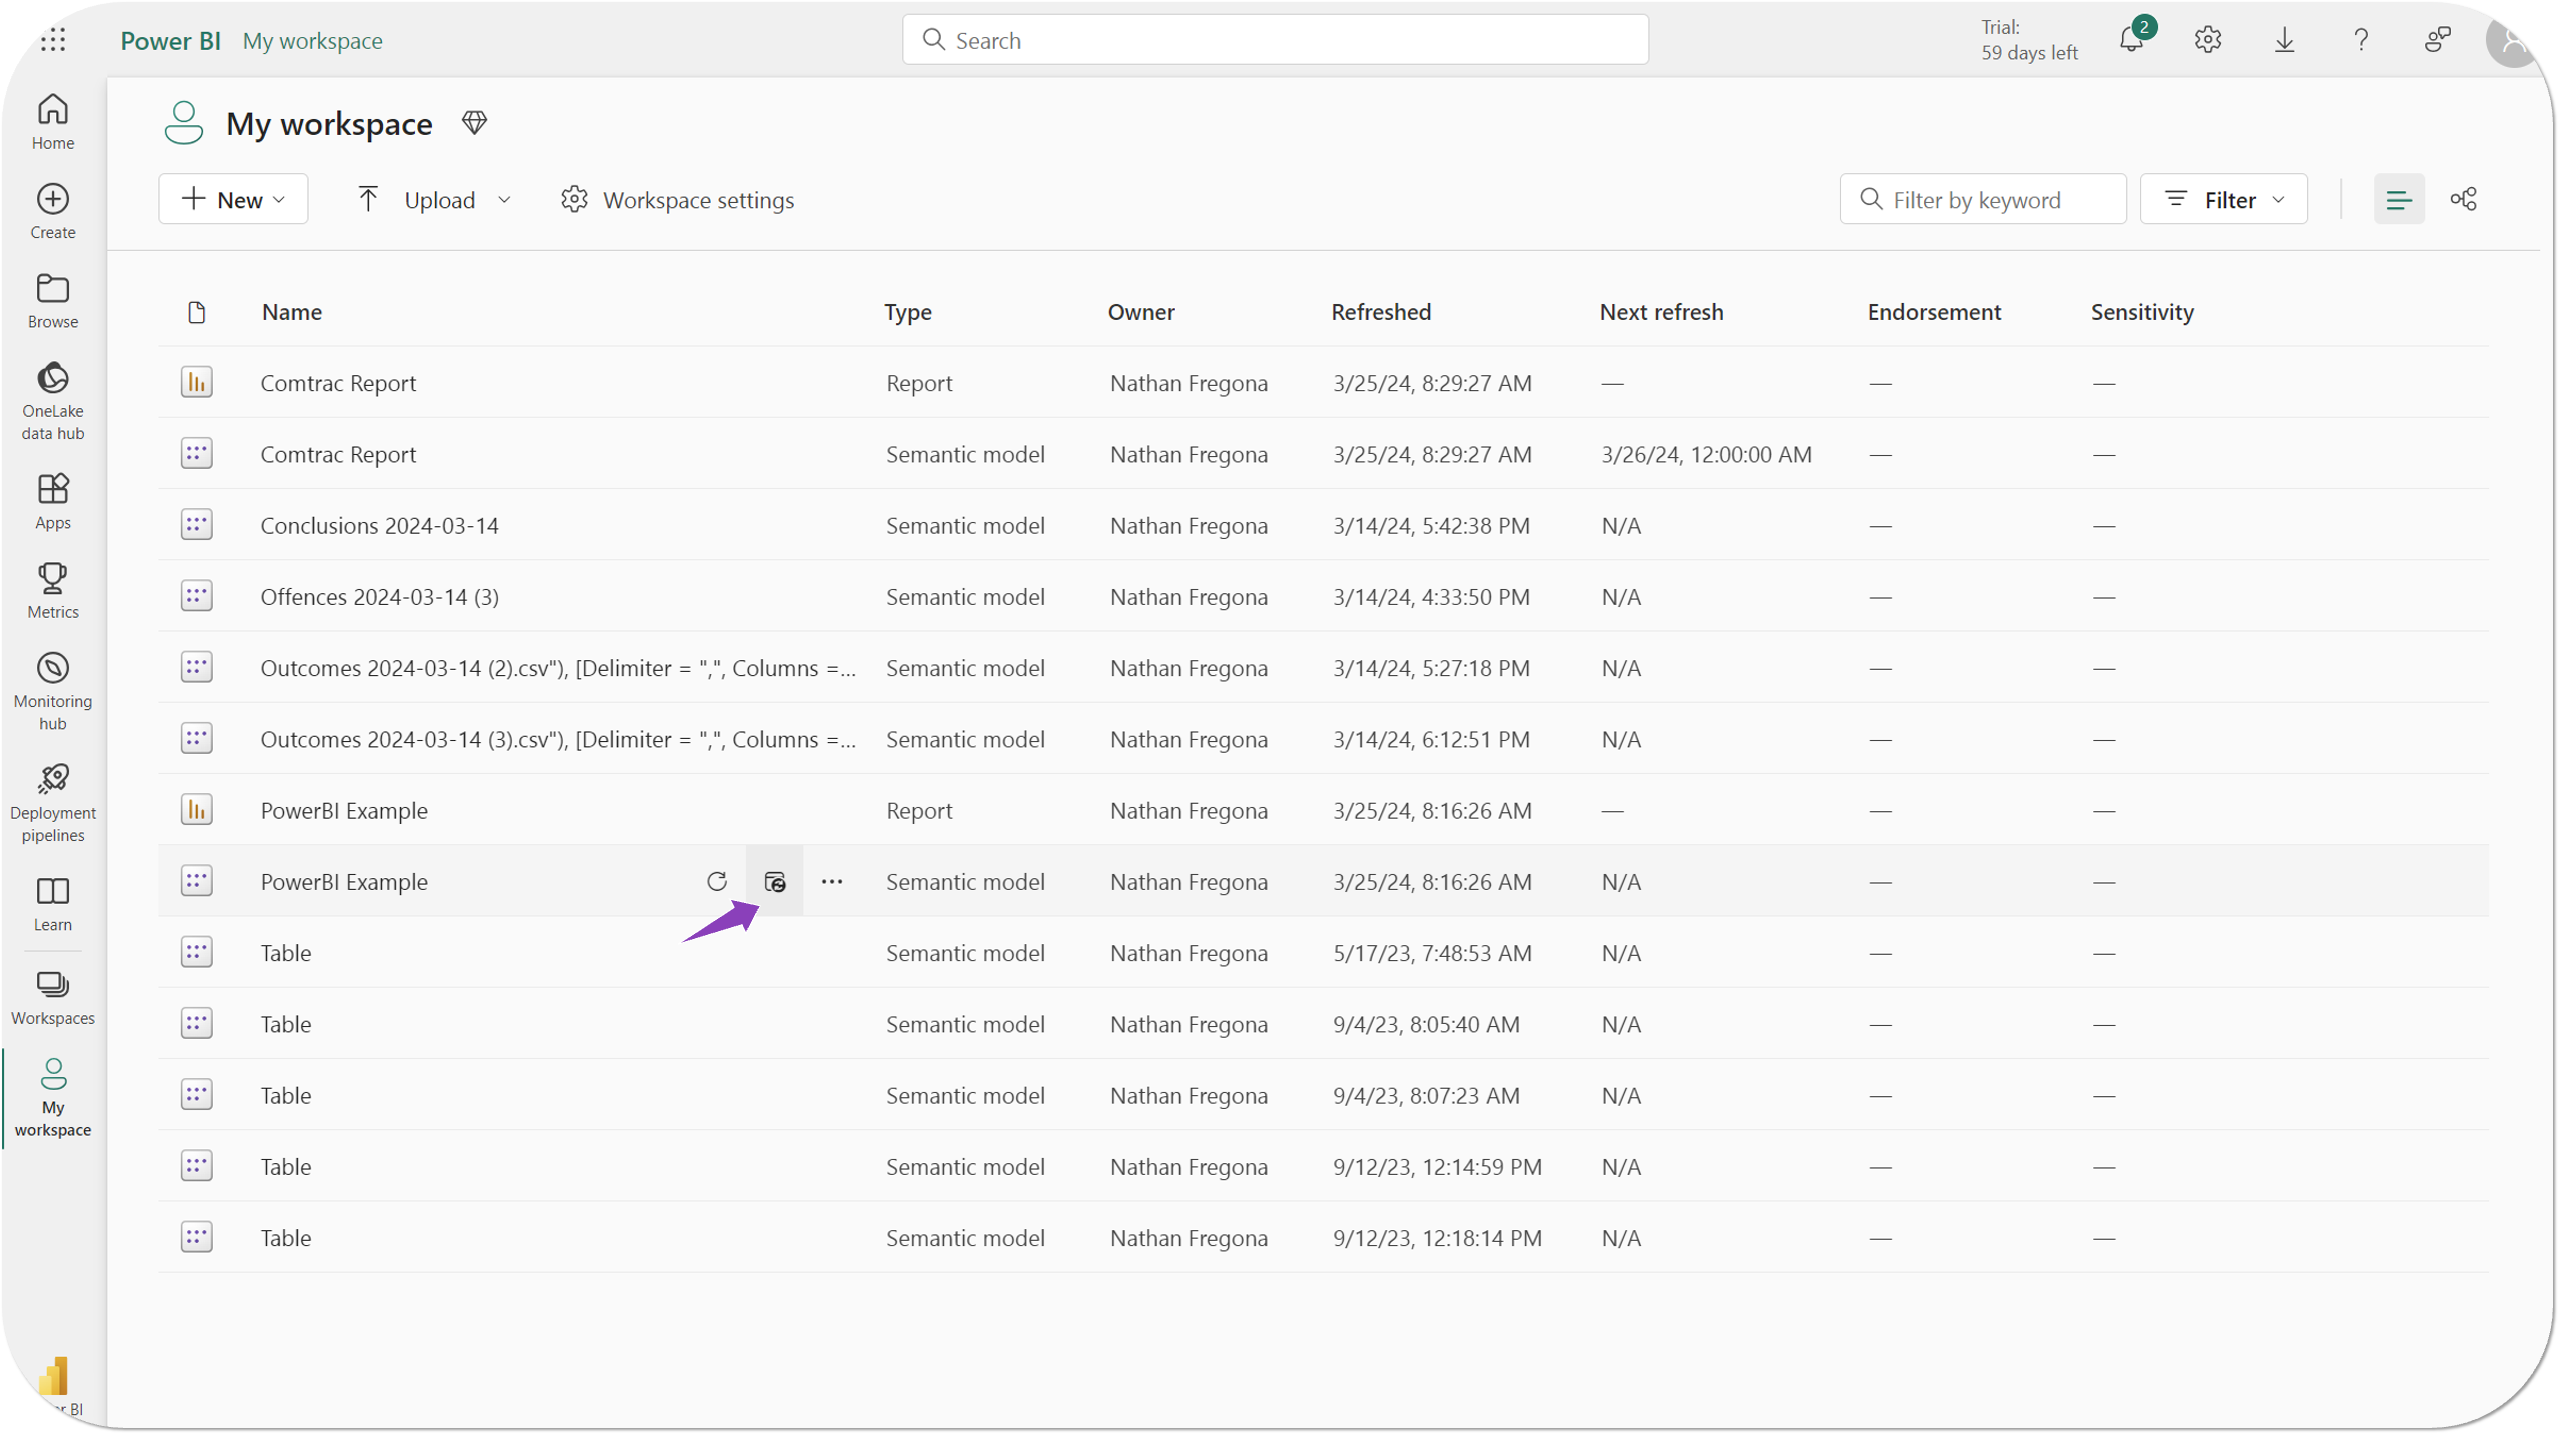
- Navigate to the relevant Semantic Model (Comtrac Statistics Report data) that is connected to your report and select the Schedule Refresh (
 ) icon.
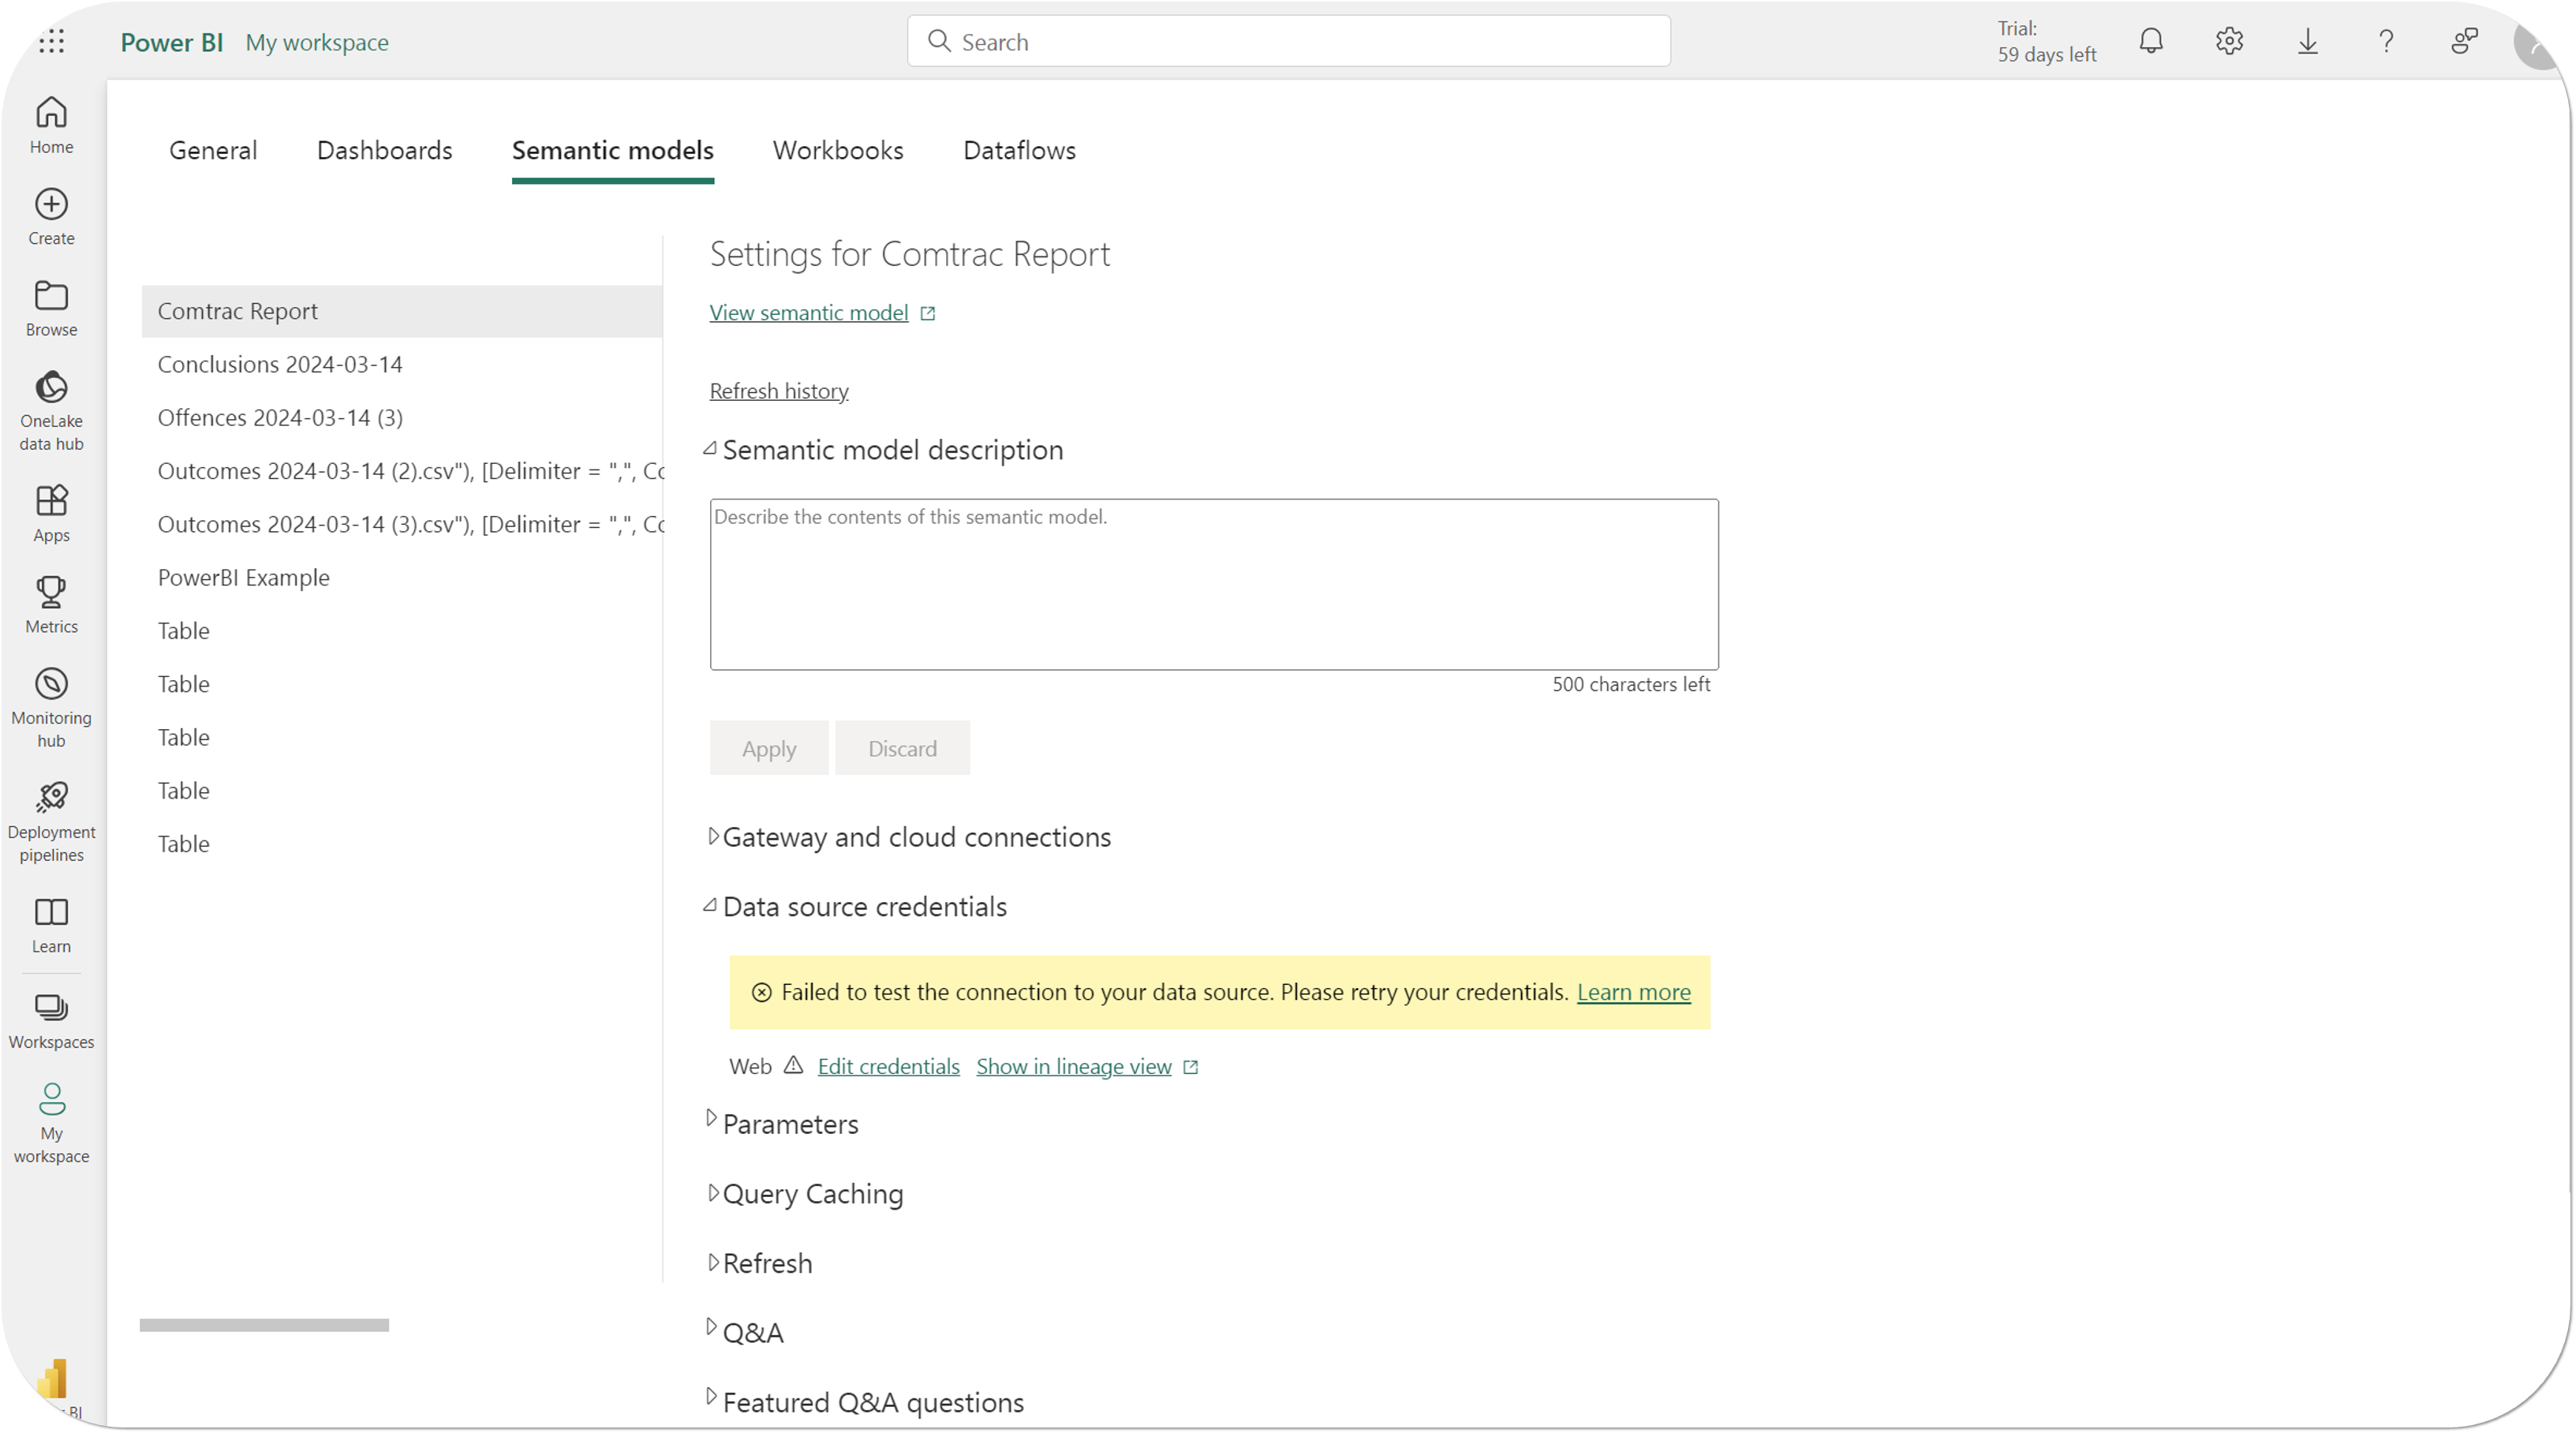
- Select Edit Credentials in the Data source credentials failure warning that is diplayed.

- NOTE: This warning displays before you enter in your Comtrac credentials for the first time in the Power BI App.
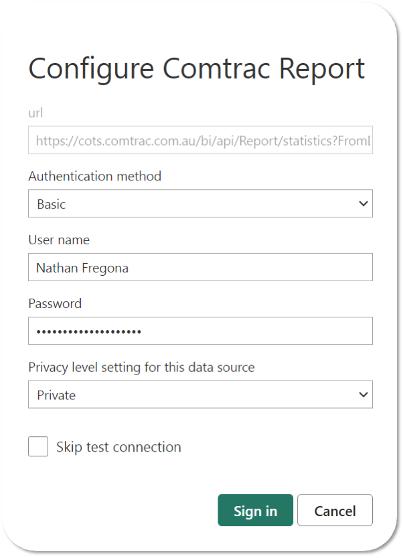
- Select the Basic Authentication Method in the pop-up box that appears and enter in your Comtrac User name and Password, choose the desired privacy level setting for the data (Private or Organizational) and select Sign-In.

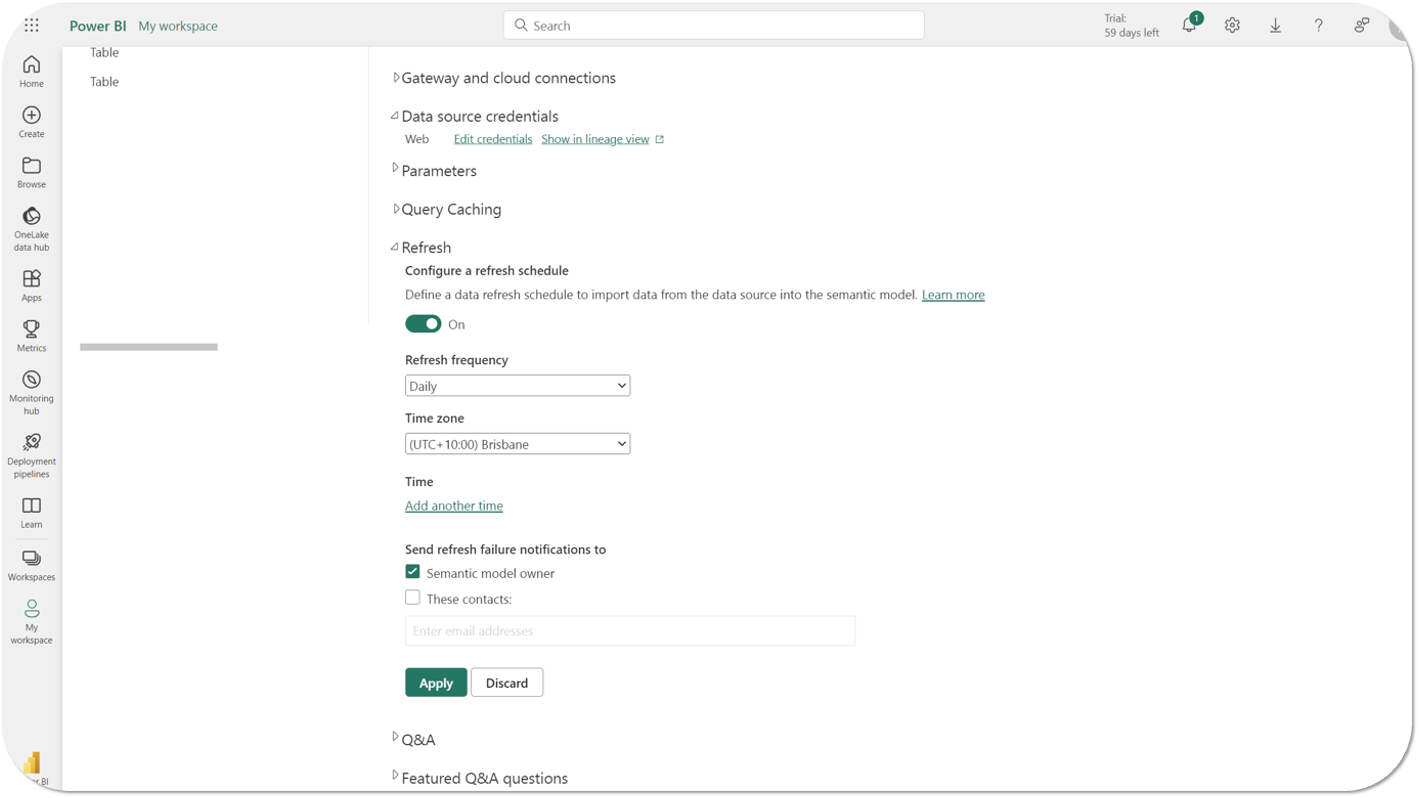
- Navigate to the Refresh heading to set a Refresh Schedule.
- Toggle the refresh scheduler ON and choose your refresh frequency (daily or weekly), time zone etc. and then Apply to set the schedule.

- NOTE: You will also need to refresh your Power BI reports themselves to add the current data (from these Semantic Models) into your templates / visuals.
- Repeat the process for any additional Semantic Models (Comtrac Statistics Reports) that have been connected into your Power BI reports.
Microsoft Learn: